
Ideology and Attitudes toward Jews in U.S. Public Opinion: A Reconsideration
Department of Political Science, Fordham University, Bronx, NY 10458, USA
Religions 2024, 15(1), 59; https://doi.org/10.3390/rel15010059
Submission received: 5 December 2023
/
Revised: 29 December 2023
/
Accepted: 30 December 2023
/
Published: 1 January 2024
(This article belongs to the Special Issue Renewal, Innovation, and Transformation: The Changing Face of Judaism in Modern Times)
Abstract
:Antisemitism has been found on both the extreme left and right among political elites. However, at the mass public level, limited research suggests right-wing antisemitism, but not much left-wing antisemitism. This paper challenges that research, at least for the U.S., offering an alternative theory. The theory argues that the lowest levels of antisemitism will be found among mainstream liberals and conservatives. Ideological moderates will exhibit higher rates of antisemitism, while those lacking an ideological orientation will show still higher antisemitic rates. Extremists of the right and left may be more antisemitic than mainstream conservatives and liberals, but the inability of standard ideological self-placement questions to distinguish extreme ideologues from the very conservative/liberal makes it difficult to test the extremism hypothesis. Numerous items measuring attitudes towards Jews in the U.S. across five major surveys finds overwhelming support for the mainstream philosemitism theory. The conclusion puts the findings into perspective and offers suggestions regarding future research.
1. Introduction
Since the mid-1800s, antisemitism has been linked to both the political far-right and far-left (Lipstadt 2019). On the right, especially in Europe, antisemitism grew out of Christian teachings and an ideology of racial supremacy, first articulated by Wilhem Marr (Zimmermann 1986; Musiedlak 2021) and later Nazi ideology (Laqueur 2006; Arendt [1958] 2012; Wodak 2018). Leftist antisemitism can be traced to Karl Marx’s “On the Jewish Question” (1843), where he argued that Judaism was parochial and thus undermined the universalism of socialism, while also linking Judaism to capitalism and bourgeois society.
Right-wing and left-wing antisemitism continue to this day, often in new forms and expressions. Strains of white supremacy and white Christian nationalism remain potent sources of antisemitism in the U.S. (Givens 2022; Levin et al. 2022; Blout and Burkart 2023; Dennen and Djupe 2023) and around the globe (Wistrich 1994; Bergmann 2008; Rubinstein 2015; Wodak and Krzyżanowski 2017). The “Unite the Right” rally in Charlottesville, Virginia on 11–12 August 2017, where marchers chanted, “Jews will not replace us,” is a prominent example of recent right-wing antisemitism.
Left-wing antisemitism has evolved into what is often called the new antisemitism. The new antisemitism links criticism of Israel, especially its policies toward the Palestinian, with animus toward Jews in general, no matter where they live (Klug 2003, 2013; Wistrich 2004, 2012, 2015; Kaplan and Small 2006; Baum and Nakazawa 2007; Gerstenfeld 2007; Hirsh 2007; Judaken 2008; Cohen et al. 2009, 2011; Kempf 2012, 2015; Tausch 2014; Ben-Moshe 2015; Rosenfeld 2015; Baum et al. 2016; Jaspal 2016; Kressel 2016; Beattie 2017; Bobako 2017; Silva 2017; Lipstadt 2019; Staetsky 2019; Brym and Lenton 2022). This new antisemitism is prevalent on numerous college campuses in the U.S., where calls to boycott, divest, and economically sanction Israel, the BDS movement, have gain currency among some students and faculty (Alterman 2016; Saxe et al. 2016; Morris 2017; Wright et al. 2017, 2021, 2022; Royden and Hersh 2022; Fraser and Fraser 2023; Hersh and Royden 2023). More recently, in the wake of the Israel-Hamas war, large anti-Israel demonstrations around the globe, with protestors chanting or carrying placards reading “from the river to the sea,” has been seen as by many as antisemitic.1
Generally, research on ideology and antisemitism focuses on elites, such as ideologues, political activists, university students, and opinion leaders. Much less is understood about the relationship between ideology and antisemitism in mass publics. There are two existing perspectives on the relationship between ideology and anti-Jewish sentiment.2 First is the “horseshoe” theory from Hersh and Royden, which argues that anti-Jewish opinion will be found on both the far-right and far-left. Second, the far-right model argues anti-Jewish sentiment is an attribute in public opinion of the right but not the left. To date, three recently published studies using survey data all find anti-Jewish opinion located more on the right than the left (Cohen 2018a; Staetsky 2020; Hersh and Royden 2023); only Hersh and Royden investigate the relationship between ideology and antisemitism in the U.S., the empirical focus of this paper.
This paper argues and presents evidence for a third perspective, which contends that mainstream liberals and conservatives will be the most positive toward Jews, at least in the U.S., the mainstream philosemitism model. Moderates, those without an ideological identification, and political extremists of the right and left will all display higher levels of anti-Jewish opinion than mainstream conservatives and liberals. Unlike the right-wing and extremism research, which focuses on ideologues and the ideology that underpins their attitudes, this alternative perspective draws on theories of the learning of tolerance norms (Chong et al. 2022) and information flows (Zaller 1992) from elites to voters.
This study uses five data sets with a variety of questions: (1) American National Election Study cumulative data from 1972 to 2020 (ANES), which uses a thermometer rating; (2) Nationscape data for 2020–2021, which uses a favorability question; (3) Voter Study Group (VSG) data for 2016, 2017, 2019, and 2020, which uses a thermometer question; (4) the Hersh and Royden (2023) data from a 2020 survey; and (5) Understanding America Study (USA) data fielded from June 2015 to January 2016, which employs 11 items from the Anti-Defamation League Global 100 survey, plus several other questions. For all questions, except three from the UAS, analysis finds support for the mainstream philosemitism model. In addition, the UAS includes one item also used in Hersh and Royden. In both studies, support is found for the right-wing, but not the mainstream philosemitism hypothesis, which suggests that attitudes toward Jews in the U.S. may vary by questions and/or be multidimensional.
This paper begins by discussing right-wing and left-wing antisemitism. One implication of this literature is that the middle (moderates) should be less antisemitic than extremists on the right or left. Then, the paper reviews and critiques the small survey research on ideology’s impact on attitudes toward Jews in mass publics. The mainstream philosemitism theory is then presented. Next, the data used here are discussed, and the analysis presented. The conclusion puts the findings into context and offers suggestions for future research.
2. Ideology and Antisemitism: Traditional Elite Based Research
At least since the mid-1800s, both the far-right and far-left have been associated with antisemitism. Right-wing antisemitism’s origin traces to Wilhem Marr, who coined the phrase in the 1870s (Zimmermann 1986; Musiedlak 2021). Marr’s ideas became an important foundation for Nazi ideology (Wodak 2018). Far-right antisemitism is a theory of white racial superiority; Jews were not thought of as whites (Kuhl 2002).
Left-wing antisemitism also has long roots, dating to Karl Marx’s treatise, “On the Jewish Question” (1843) (Blanchard 1984). The far-left perceived two threats from Jews. One, they viewed Judaism as parochial, which undercut the universalism of their socialist project. Two, they also associated Jews with capitalism, especially banking and finance. The Soviet Union gave leftist antisemitism another rationale, viewing Jews as enemies of the state, and later viewing Israel as antagonistic to Soviet foreign policy aims in the Middle East (Korey 1972; Pinkus 1988). More recently, a new leftist antisemitism has emerged, which is critical of Israel, especially its policies toward the Palestinians. At times, these critics generalize that antipathy to all Jews, irrespective of where they live (see the studies cited above). One implication of this research is that those in the middle, such as political moderates, should be the least antisemitic, the horseshoe theory discussed in Hersh and Royden (2023).
Ideology and Antisemitism in Public Opinion Research
Most of the research on ideology and antisemitism focuses on elites, such as political leaders and activists, ideologues, college students, and opinion leaders. Still, there is a massive literature that uses public opinion data for evidence on the levels and sources of antisemitism in mass publics. Owing perhaps to the influence of early studies, particularly Adorno et al. (1950), much of that research focuses on personality and demographic factors associated with antisemitism. This research assumes that certain personality and/or demographic traits are more likely to be found on the right versus the left side of the political spectrum, such as authoritarian personality (Adorno et al. 1950; Dunbar 1995; Raden 1999; Dunbar and Simonova 2003; Krekó 2012); anomie, alienation, dogmatism, misanthropy, victimhood, and low self-esteem (Crandall and Cohen 1994; Smith 1997; Frindte et al. 2005; Duckitt 2009; Antoniou et al. 2015); traditionalism (Weil 1985; Weitzman 2017); Christian religiosity (Nicholls 1995; Pargament et al. 2007; Tausch 2018); and social/national identity (Bergmann and Erb 2003).
There are several limitations of this research for the question of ideology and antisemitism. First, much of that research is dated and conducted before the rise of the new antisemitism, which, as noted above, may link the left with antisemitic beliefs. Second, these types of personality variables are not direct measures of ideology.3
Still, several studies directly assess the effects of ideology on antisemitic attitudes. Bergmann and Erb’s (2003) study of Germans in the 1990s found more antisemitism on the right than the center or left. Frindte et al. (2005) studied German youth ages 14–18 and a national sample in the early 2000s and found that right-leaning subjects were more likely to hold antisemitic beliefs than those on the left. Neither study, however, was primarily interested in the relationship between ideology and antisemitism.
Three more recent studies make the question of ideology and antisemitism the core of their research. First, Cohen (2018a), using data from 20 nations surveyed in the 2014 European Social Survey, found antisemitic attitudes were located more on the right than the left on a question about increased Jewish immigration. However, this question may better tap immigration attitudes than antisemitism.4 Staetsky (2020) conducted a survey in 2016–2017 Great Britain, paying considerable attention to measuring antisemitism. He constructed an index composed of eight items.5 He found being very right wing was associated with a greater tendency toward antisemitism, but for the someone fairly right wing “the probability of having antisemitic attitudes is no different from the benchmark average individual” (p. 281). Individuals on the left are even less likely to hold antisemitic attitudes than the benchmark average individual.6
Finally, Hersh and Royden (2023) surveyed Americans in November 2020, oversampling young people. They measure antisemitism with three questions, one about Jews being more loyal to Israel, one concerning support of the BDS boycott, and one contending that Jews have too much power.7 They too find that those on the right are more likely to hold antisemitic opinion than those to their left. Those on the extreme right, who identify at alt-right, “stand out with the highest rate of support for antisemitic statements” (p. 702). Hersh and Royden also find that conservative aged 31+ show no greater tendency to support antisemitic statements than anyone else; antisemitism seems most strongly associated with young (18–30 years) people who identity as very conservative.
Staetsky and Hersh and Royden are important for attempting to distinguish between extremists and others who lean heavily to the right or left but still consider themselves to be in the political mainstream. Despite doing so, all research suggests the right-wing model better describes the ideological basis of antisemitism in mass publics in the western nations than the horseshoe theory.
3. A Theory of Ideology and Antisemitic Attitudes in the U.S.
This paper argues that neither the right-wing nor the horseshoe theories correctly identify the current relationship between ideology and antisemitism in mass publics in western societies. A theory of ideology and antisemitism in western mass publics should account for (1) how the U.S. transformed from a strongly antisemitic nation in the mid-twentieth century into one of the least antisemitic today, and (2) the relationship between ideology and antisemitism. The theory developed here recognizes the protean and changeable nature of antisemitism—any theory is likely to be specific to time and place. Since stereotypes of Jews will very over time and place, it is important to test ideology’s impact across many questions measuring attitudes toward Jews. This study employs 17 questions across five data sets.
3.1. Trends in Attitudes toward Jews in the U.S.
Dinnerstein (1995) argues Americans have become increasingly positive toward Jews over time, stating in 2016 that “antisemitism is too minor an issue to think about” (p. 59) (Dinnerstein 2016). Due to the lack of historical survey data, we cannot track the level of antisemitism in public opinion earlier than the 1930s (Welch 2014). Further, there are few comparable questions (Smith 1993), and when comparable questions exist, there are large time gaps between them.
Still several questions series suggest Americans have become increasingly positive toward Jews. Since 1937, the Gallup poll has been asking respondents whether they would vote for a well-qualified Jewish candidate for president if nominated by their party. In 1937, 46% answered yes, although the question did not use the phrase “nominated by their party”. In 1958, with party nomination referenced, 62% said they would, a figure that climbed to about 90% by the late 1980s, where it has remained.
Susan Welch (2014) investigated polls during the Second World War. In surveys conducted in 1942, 1944, and 1945, 42%, 50%, and 56%, respectively, said that Jews had too much power and influence in the United States (p. 624). That exact question was not asked afterward, but in 1987, the CBS News/New York Times (1987) poll asked if “In general, do you think Jews have too much power in the United States, or not?” Keeping in mind question wording differences, the 1987 poll found 21% said Jews had too much power, 65% said not too much, and 14% said “Don’t Know”.
Other comparable polls only exist from the mid-1960s. The American National Election Study (ANES) included a feeling thermometer in 1964, which has been asked of respondents on occasion since then. In 1964, Jews received a 62 rating from non-Jewish Americans, reaching nearly 75 in 2016 and 2020 (Cohen 2018b). Second, under the auspices of the Antidefamation League, three questions were asked beginning in 1964. The first reads, “Jews in the United States are more loyal to Israel than to this country”. In 1964, a National Opinion Research Organization (NORC) survey found 30% agreeing, while the 2015 ADL Global 100 Survey found 33% agreement, no discernible change. The second and third questions from the same two sources found positive change toward Jews. In 1964, 29% agreed that “Jews have too much power in the business world” compared to 16% in 2015, while 26% agreed that “Jews don’t care what happens to anyone but their own kind,” to which only 13% agreed in 2015, shifts of 13% in both cases.
3.2. American Elite Conversion from Antisemitism to Philosemitism
Despite data limitations, Americans became strongly positive toward Jews on average since the 1930s. Why? The theory to explain this begins with the assumption that Jews are not salient for most Americans, most of the time. Average Americans do not (and have not) spent much time thinking or learning about Jews.
Hence, average Americans seek guidance from trusted sources when developing an opinion about Jews. Historically, religion served as the foundation for American thought regarding Jews. Since religions in the U.S. were often hostile to Jews, blaming Jews for instance for the death of Christ, Americans were likely to hold negative attitudes toward Jews (Dinnerstein 1995). However, as American society secularized and religion became a less important part of Americans’ lives (Roth 2016; Roth et al. 2017), ordinary people looked toward others, primarily secular elites, when deciding about Jews.
Since the end of the Second World War, a consensus among mainstream political elites formed. By mainstream political elites, I mean most leaders of the two parties, elected officials in Congress, top members of the presidents’ administrations, and journalists working for major publications and broadcasters. These elites viewed Jews positively (Brodkin 1998). Several factors may account for this positive consensus, such as the horrors of the Holocaust, the rise of the Civil Rights movement, the Vatican’s Nostra Aetate decision in 1965, and the view of Israel as a key ally in the Middle East. Conservatives and liberal alike support Israel, but perhaps for different reasons, with conservatives and Republicans preferring Jewish rule of Israel and Christian holy sites over Islam control, while liberals and Democrats support Israel because of the large number of American Jewish constituents in that party.8 Further, although Jews lean liberal and Democratic in their politics, Weisberg (2019) shows that there are many conservative and Republican Jews. Similarly, despite the Democratic tilt of campaign money by Jews, there are important Jewish financial sources for Republicans, including Stephen Schwarzman, Sheldon Adelson, Jeffrey Yass, Bernard Marcus, and Paul Singer.9 Clearly, more work needs to be conducted substantiating the claim that a mainstream elite consensus regarding Jews developed in the second half of the twentieth century (Dinnerstein 1995).
3.3. Elite Consensus and Attitudes of Average Americans toward Jews
Now, assume that the positive elite consensus toward Jews exists in the mainstream American elite. How does that elite consensus affect the attitudes of ordinary Americans toward Jews across the ideological spectrum?
The elite consensus creates a one-side information flow from elites to voters (Zaller 1992) regarding attitudes towards Jews. Zaller’s information flow theory predicts two elements will affect the persuasiveness of a message, reception and acceptance. Voters’ ideological identification will affect how receptive and/or accepting they are to mainstream elite messages.
This information flow model predicts that conservative and liberal individuals will have the highest regard for Jews because they are more likely to receive messages, a function of the relative amount of attention they pay to politics and news, and their willingness to accept messages from elites about Jews. Liberals and conservatives will be highly likely to follow the lead of mainstream political leaders regarding Jews. This hypothesis contrasts with the right-wing antisemitism perspective, arguing that both conservatives and liberals will be positive toward Jews.
Moderates will register lower levels of positive sentiment toward Jews than liberals and conservatives primarily because they are less receptive to elite messages; they pay less attention to news and politics than do liberals and conservatives. Like liberals and conservatives, they will accept positive messages from mainstream elites about Jews, but the impact of such messages is weakened due to the limited receptivity to those messages. This hypothesis contrasts with the horseshoe model, which predicts the strongest regard for Jews among moderates.
Many studies that employ ideological self-placement items tend to discard the “don’t knows,” those who lack an ideological identification, from the analysis, but “don’t knows” are important to the mainstream philosemitism theory. Don’t Knows should exhibit lower regard for Jews than moderates (and by implication liberals and conservatives) because of their comparatively low receptivity levels. They pay very little attention to news and politics. Thus, they are unlikely to receive messages from mainstream elites about Jews, and it is unclear when they receive such messages whether they will be accepting. Their attitudes toward Jews are likely to be inchoate and confused, and perhaps based on dated and discredited stereotypes.
Finally, the theory makes predictions about extremists. Political extremists of both the left and right will be less positive toward Jews than liberals and conservatives primarily because of their resistance to messages from the mainstream political elite. Such extremists are likely to pay considerable attention to news and politics, although they may tend to consume such content from non-mainstream news outlets. It is unclear whether extremists will be more or less positive toward Jews than moderates and “don’t knows”.
4. Data
The analysis below uses numerous questions from multiple data sets to test the above hypotheses. It is not clear how best to measure attitudes towards Jews. Different items may elicit different responses, perhaps because they evoke different images and stereotypes of Jews. Antisemitism in mass publics may be multidimensional. Hence, the decision was made to employ a host of questions, which come from these data sources: American National Election Study (ANES) Cumulative datafile (1972–2020), Nationscape (2019–2021), Voter Study Group (VSG) from 2016 to 2020, Understanding American Study (2015), and the Hersh-Royden data (2020).
ANES measures attitudes toward Jews with a feeling thermometer, measuring ideology with a seven-point scale from with the following categories: Extremely Liberal, Liberal, Slightly Liberal, Slightly Conservative, Conservative, Extremely Conservative, as well as a Don’t Know option. Nationscape uses a favorability question to measure attitudes toward Jews, with the following categories: Very Favorable, Favorable, Unfavorable, Very Unfavorable, and Not Sure. The ideological item has these categories: Very Liberal, Liberal, Moderate, Conservative, Very Conservative, and Not Sure.
There are four VSG surveys that ask about Jews: 2016, 2017, November 2019, and September 2020. All VSG surveys ask respondents about their ideological self-identification. Like ANES, VSG uses a feeling thermometer to register attitudes toward Jews, but only employs the five-category ideology question, like Nationscape: Very Liberal, Liberal, Moderate, Conservative, Very Conservative, and Not Sure.
Fourth are the Hersh-Royden data. These data offer an important test of the hypotheses because Hersh and Royden find support for a linear relationship in which liberals have more positive assessments of Jews than conservatives, with moderates falling in between. Second, where the ANES, Nationscape, and VSG use general measures of attitudes toward Jews with thermometer or favorability ratings, Hersh and Royden use more specific questions. Their questions asked about Jewish loyalty, support for boycott, and whether Jews have too much power. The question wordings are provided here:
- Jews are more loyal to Israel than to America.
- It is appropriate for opponents of Israel’s policies and actions to boycott Jewish American owned businesses in their communities.
- Jews in the United States have too much power.
Respondents are asked whether they agree or disagree with these statements, with five possible categories: Strongly Agree, Somewhat Agree, Neither Agree nor Disagree, Somewhat Disagree, and Strongly Disagree.
Hersh and Royden employ a seven category ideological self-identification question, which asks respondents to rate themselves from very liberal to very conservative but are not offered a “Not Sure” or “Don’t Know” option. Their survey, conducted by YouGov, has a second ideological self-identification question with five categories (Very Liberal, Liberal, Moderate, Conservative, and Very Conservative) and a “Not Sure” option. On the five-category question, 8.45% select “Not Sure”. A cross-tabulation finds that while a plurality (63.6%) of these “Not Sure” respondents selected the middle position (4) on the seven-category ideology question, about one-third did not, including some who selected very liberal or very conservative. Such “errors” are indicative of respondents who are less knowledgeable about politics and are a common criticism of using ideological self-placement.10 Since the theory presented here hypothesizes that “Not Sure” respondents will be less positive toward Jews than moderates, I recoded the seven-category ideology variable, creating a “Not Sure” category from the answers to the five-category ideology question. The resulting variable has the seven categories from Very Liberal to Very Conservative and a “Not Sure” category, for a total of eight categories. The middle category from Very Liberal to Very Conservative is classified for analysis purposes here as “moderate”.
Finally, the fifth data set comes from the Understanding American Study (UAS) conducted in 2015. The UAS study contains the 11 items from the ADL Global 100, two additional specific questions, and the favorability question. The UAS study is important because of the large number of questions, allowing us to assess whether question wording affects the relationship between ideology and antisemitic attitudes. Table 1 lists the questions from the UAS 2015 study.
Greene and Kingsbury (2017), the UAS study designers, critiqued the ADL Global 100 questions for not including a “Don’t Know” option. The UAS survey allows a “Don’t Know” response for the ADL questions. Greene and Kingsbury find higher antisemitism levels without a “Don’t Know” option. I recoded the UAS questions such that the antisemitic option receives the lowest score and have retained the “Don’t Know” category. This design produces the following codes for the 11 questions from the ADL Global 100: 5 = Completely Disagree, 4 = Disagree, 3 = Don’t Know, 2 = Agree, and 1 = Completely Agree, except for the item “Jews are just like everyone else” because higher values already are positive toward Jews. Favorability also uses a 5-point scale that is scored as follows: 5 = Very Favorable, 4 = Favorable, 3 = Don’t Know, 2 = Unfavorable, and 1 = Very Favorable. Fortunately, the UAS study contains the “Jewish Loyal” question used by Hersh-Royden, with only minor wording differences. For ideology, UAS asks respondents to rate themselves on a 10-point scale from Very Liberal to Very Conservative but does not have a “Don’t Know” option, which precludes testing hypotheses about the level of antisemitism among non-ideologues.
5. Analysis
The analysis proceeds data source by data source in this order: ANES, Nationscape, VSG, Hersh-Royden, and UAS.
5.1. ANES Data
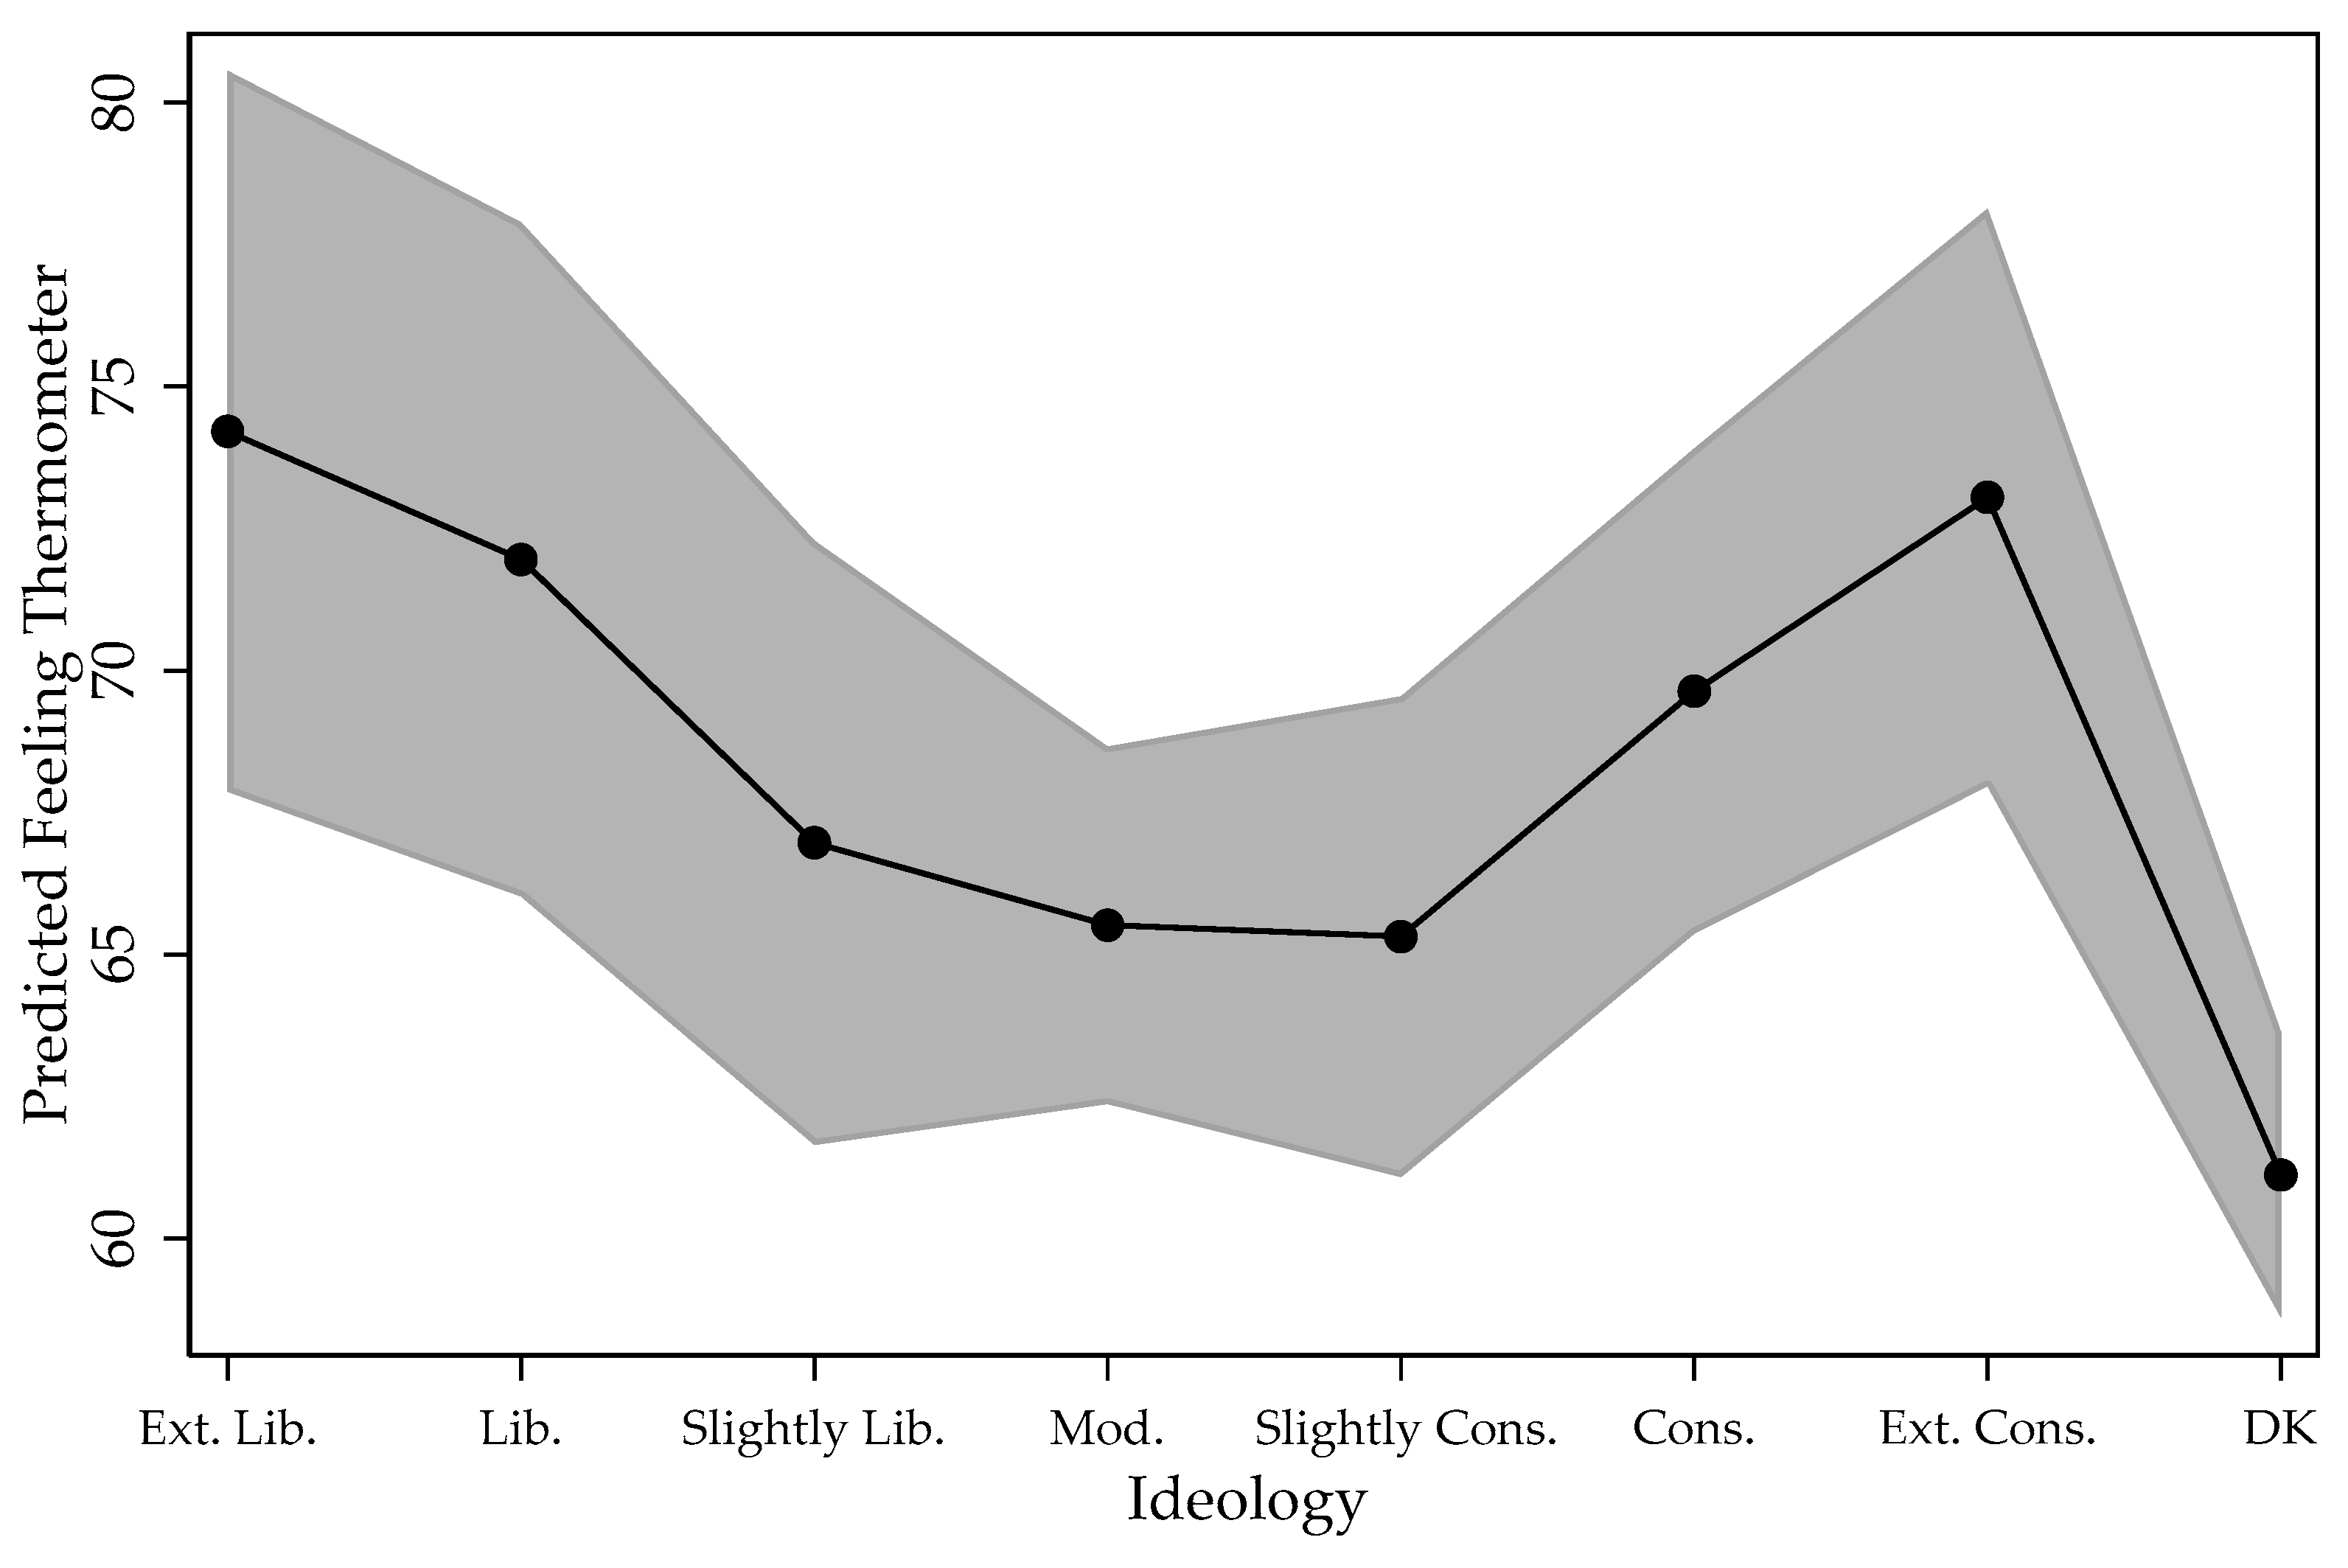
Figure 1 presents the marginal effects plot using the ANES data on the effects of ideological self-identification, including “Don’t Know,” based on a regression equation using factor variables and clustering on the year of the survey. In this and all estimations, the reference category is “moderates”. Regression results are presented in Appendix A Table A1. The ANES does not include the feeling thermometer for Jews for every survey. The survey only began asking the ideology question in 1972 and lacks midterm election studies in 2006, 2010, 2014, and 2018. Thus, there are ANES data for these study years: 1972, 1976, 1988, 1992, 2000, 2002, 2004, 2008, 2016, and 2020. As is the case for all analyses, Jews are excluded, for a total n of 22,788.
Results confirm the hypotheses about moderates and Don’t Knows from the mainstream philosemitism theory. Warmth toward Jews is highest among the extreme liberals and conservatives, with little evidence of greater warmth among extreme liberals (74) versus extreme conservatives (73). Warmth declines toward the moderate category (65), although slight conservatives have a nearly identical predicted score at 65. Furthermore, Don’t Knows give Jews the coolest rating at 61. Using a standard of p < 0.05 here and in subsequent comparisons, the rating of moderates is statistically different from that of extreme liberals (F = 27.42, p = 0.0005) and extreme conservatives (F = 63.36, p = 0.000). There is a statistically significant difference between moderates and Don’t Knows (F = 39.45, p = 0.0001), but the difference between extreme liberals and extreme conservatives is not statistically significant (F = 1.24, p = 0.29).
It is not clear why extreme liberals and conservatives are warmer toward Jews than liberals and conservatives, when the mainstream philosemitism theory predicted the reverse. But ideological self-identification questions may have difficulty distinguishing political extremists, as defined above, from individuals who are very conservative (liberal). In deciding on self-placement in the ANES, very conservative (liberal) respondents may have felt closer to the “extreme” category than the unmodified conservative (liberal) category, perceiving “extreme” and “very” as similar.
5.2. Nationscape Data
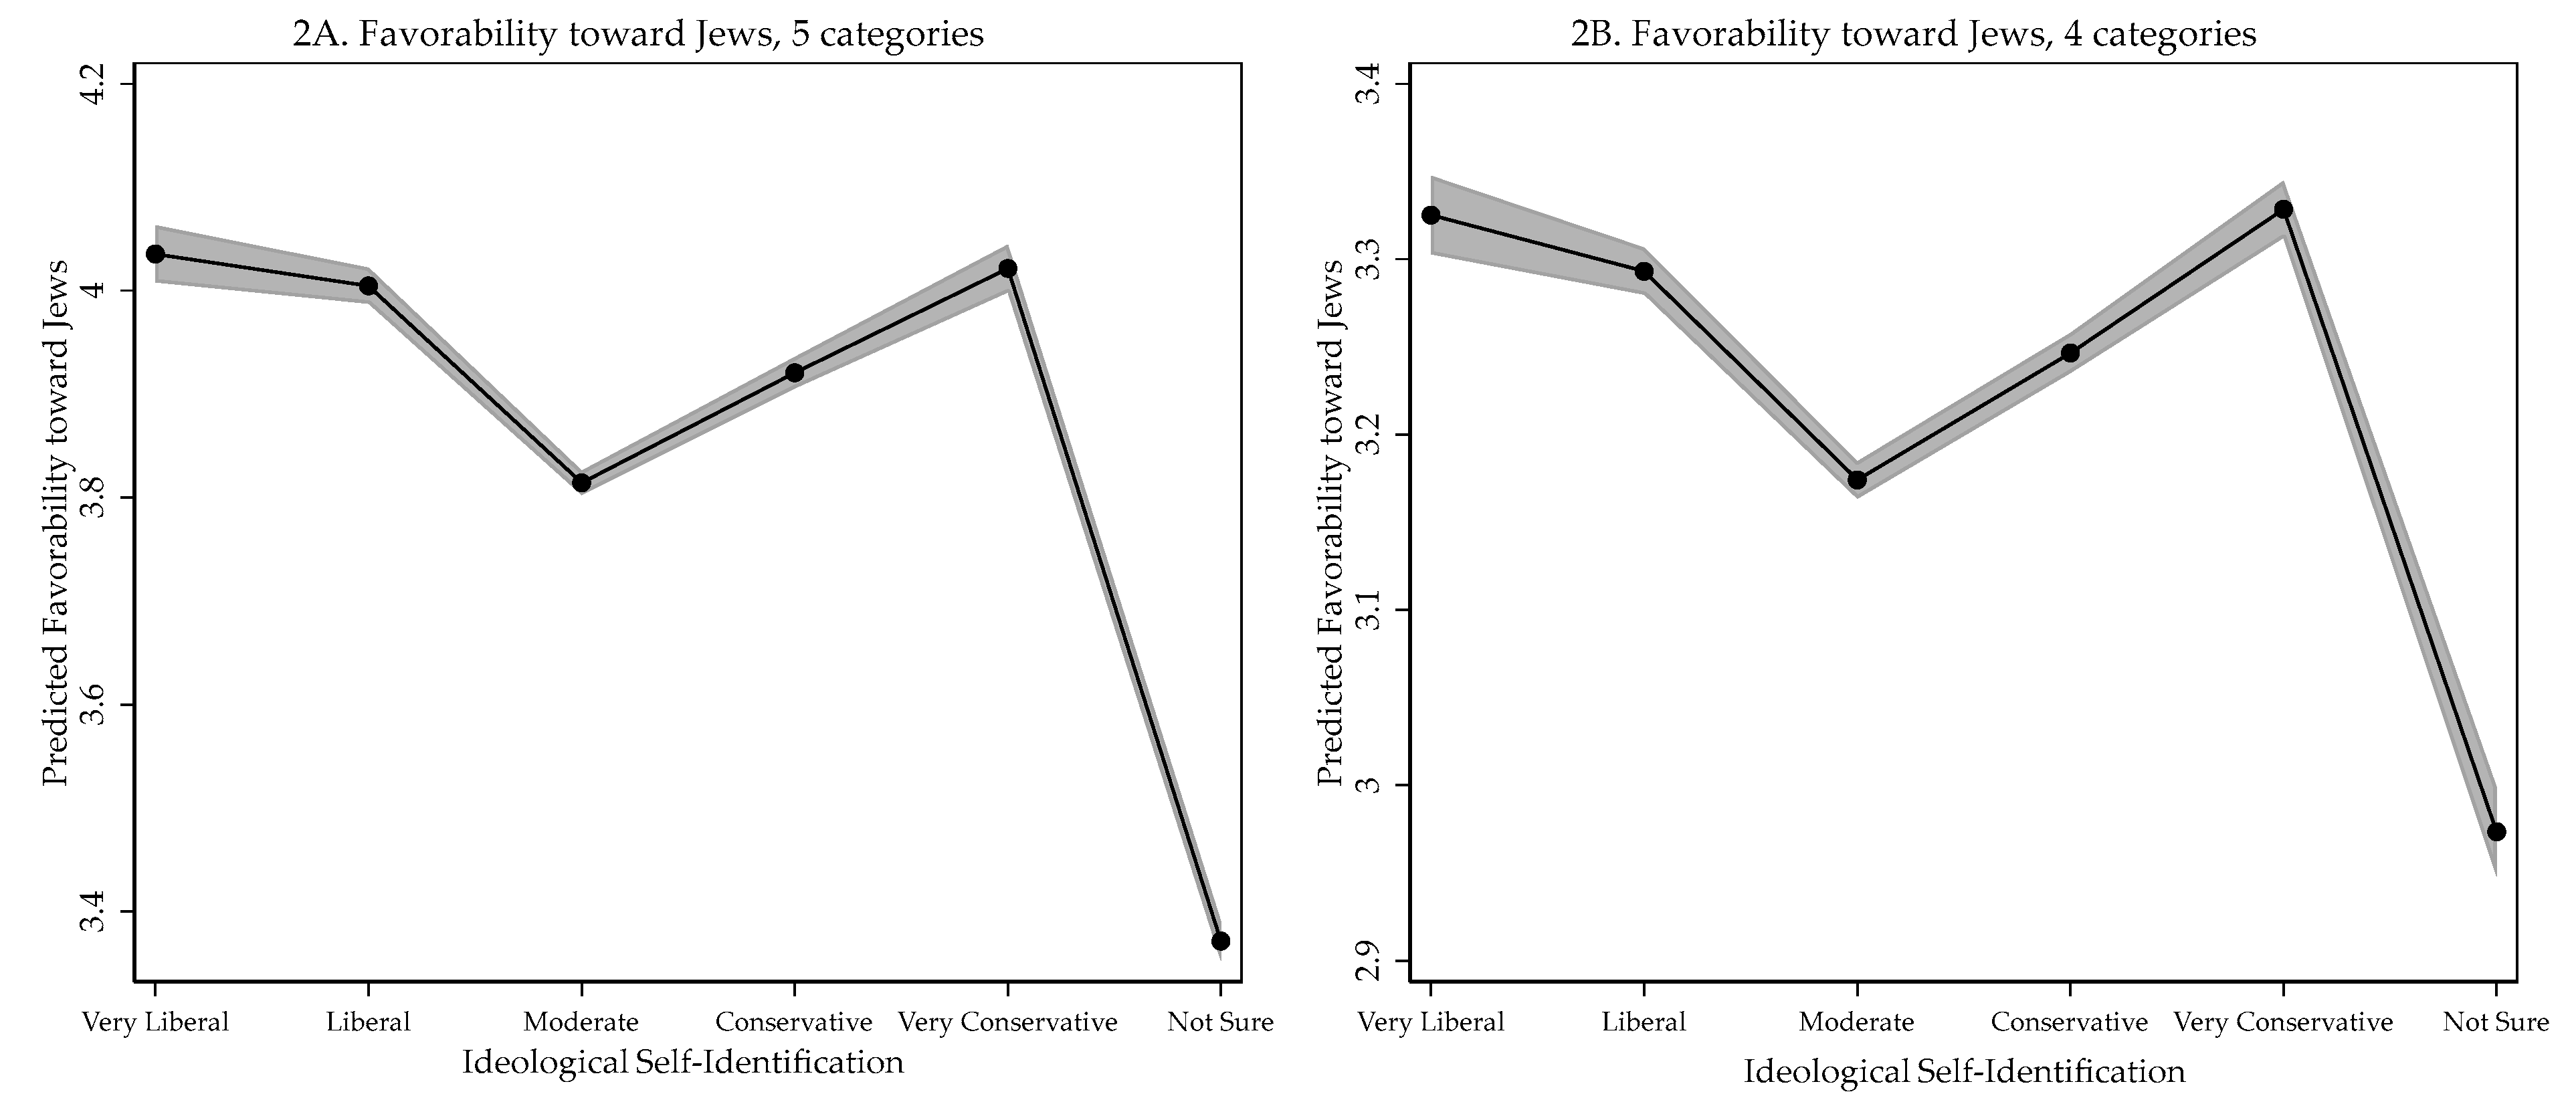
Figure 2 presents the marginal effects plot using the Nationscape data, while Appendix A Table A2 presents the regression results. Nationscape uses five ideological categories, ranging from Very Liberal to Very Conservative, and allows a “Don’t Know” category. Attitudes toward Jews are measured with a favorability question, which ranges from Very Favorable to Very Unfavorable, and a Don’t Know category is offered. There are two analyses, one that scores “Don’t Know” toward Jews as the middle category and another that excludes the “Don’t Knows,” producing five-category and four-category favorability dependent variables, presented in Figure 2A and Figure 2B, respectively.
Results of the analyses using the Nationscape data provide support for the main hypotheses. Favorability toward Jews is highest among the very liberal and very conservative. Favorability ratings decline as one moves to the liberal (conservative) categories, and moderates display even less favorable ratings, with the “Not Sure” respondents displaying the lowest favorability ratings. Yet, even the “Not Sure” respondents tilt in a favorable direction, scoring 3.4 on the five-point scale and 3 on the four-point scale. The difference in the favorability ratings for the very liberal and very conservative compared to the “Not Sure” is about 0.6 on the five-point scale and about 0.4 on the four-point scale. The difference in the ratings of very liberal and very conservative respondents is significantly statistically different from the moderates, and the ratings of moderates is significantly statistically different from the “Not Sure” respondents, which may be due to the large n’s. However, the difference in the favorability ratings of very liberal and very conservative respondents is not statistically significant.11
5.3. VSG Data
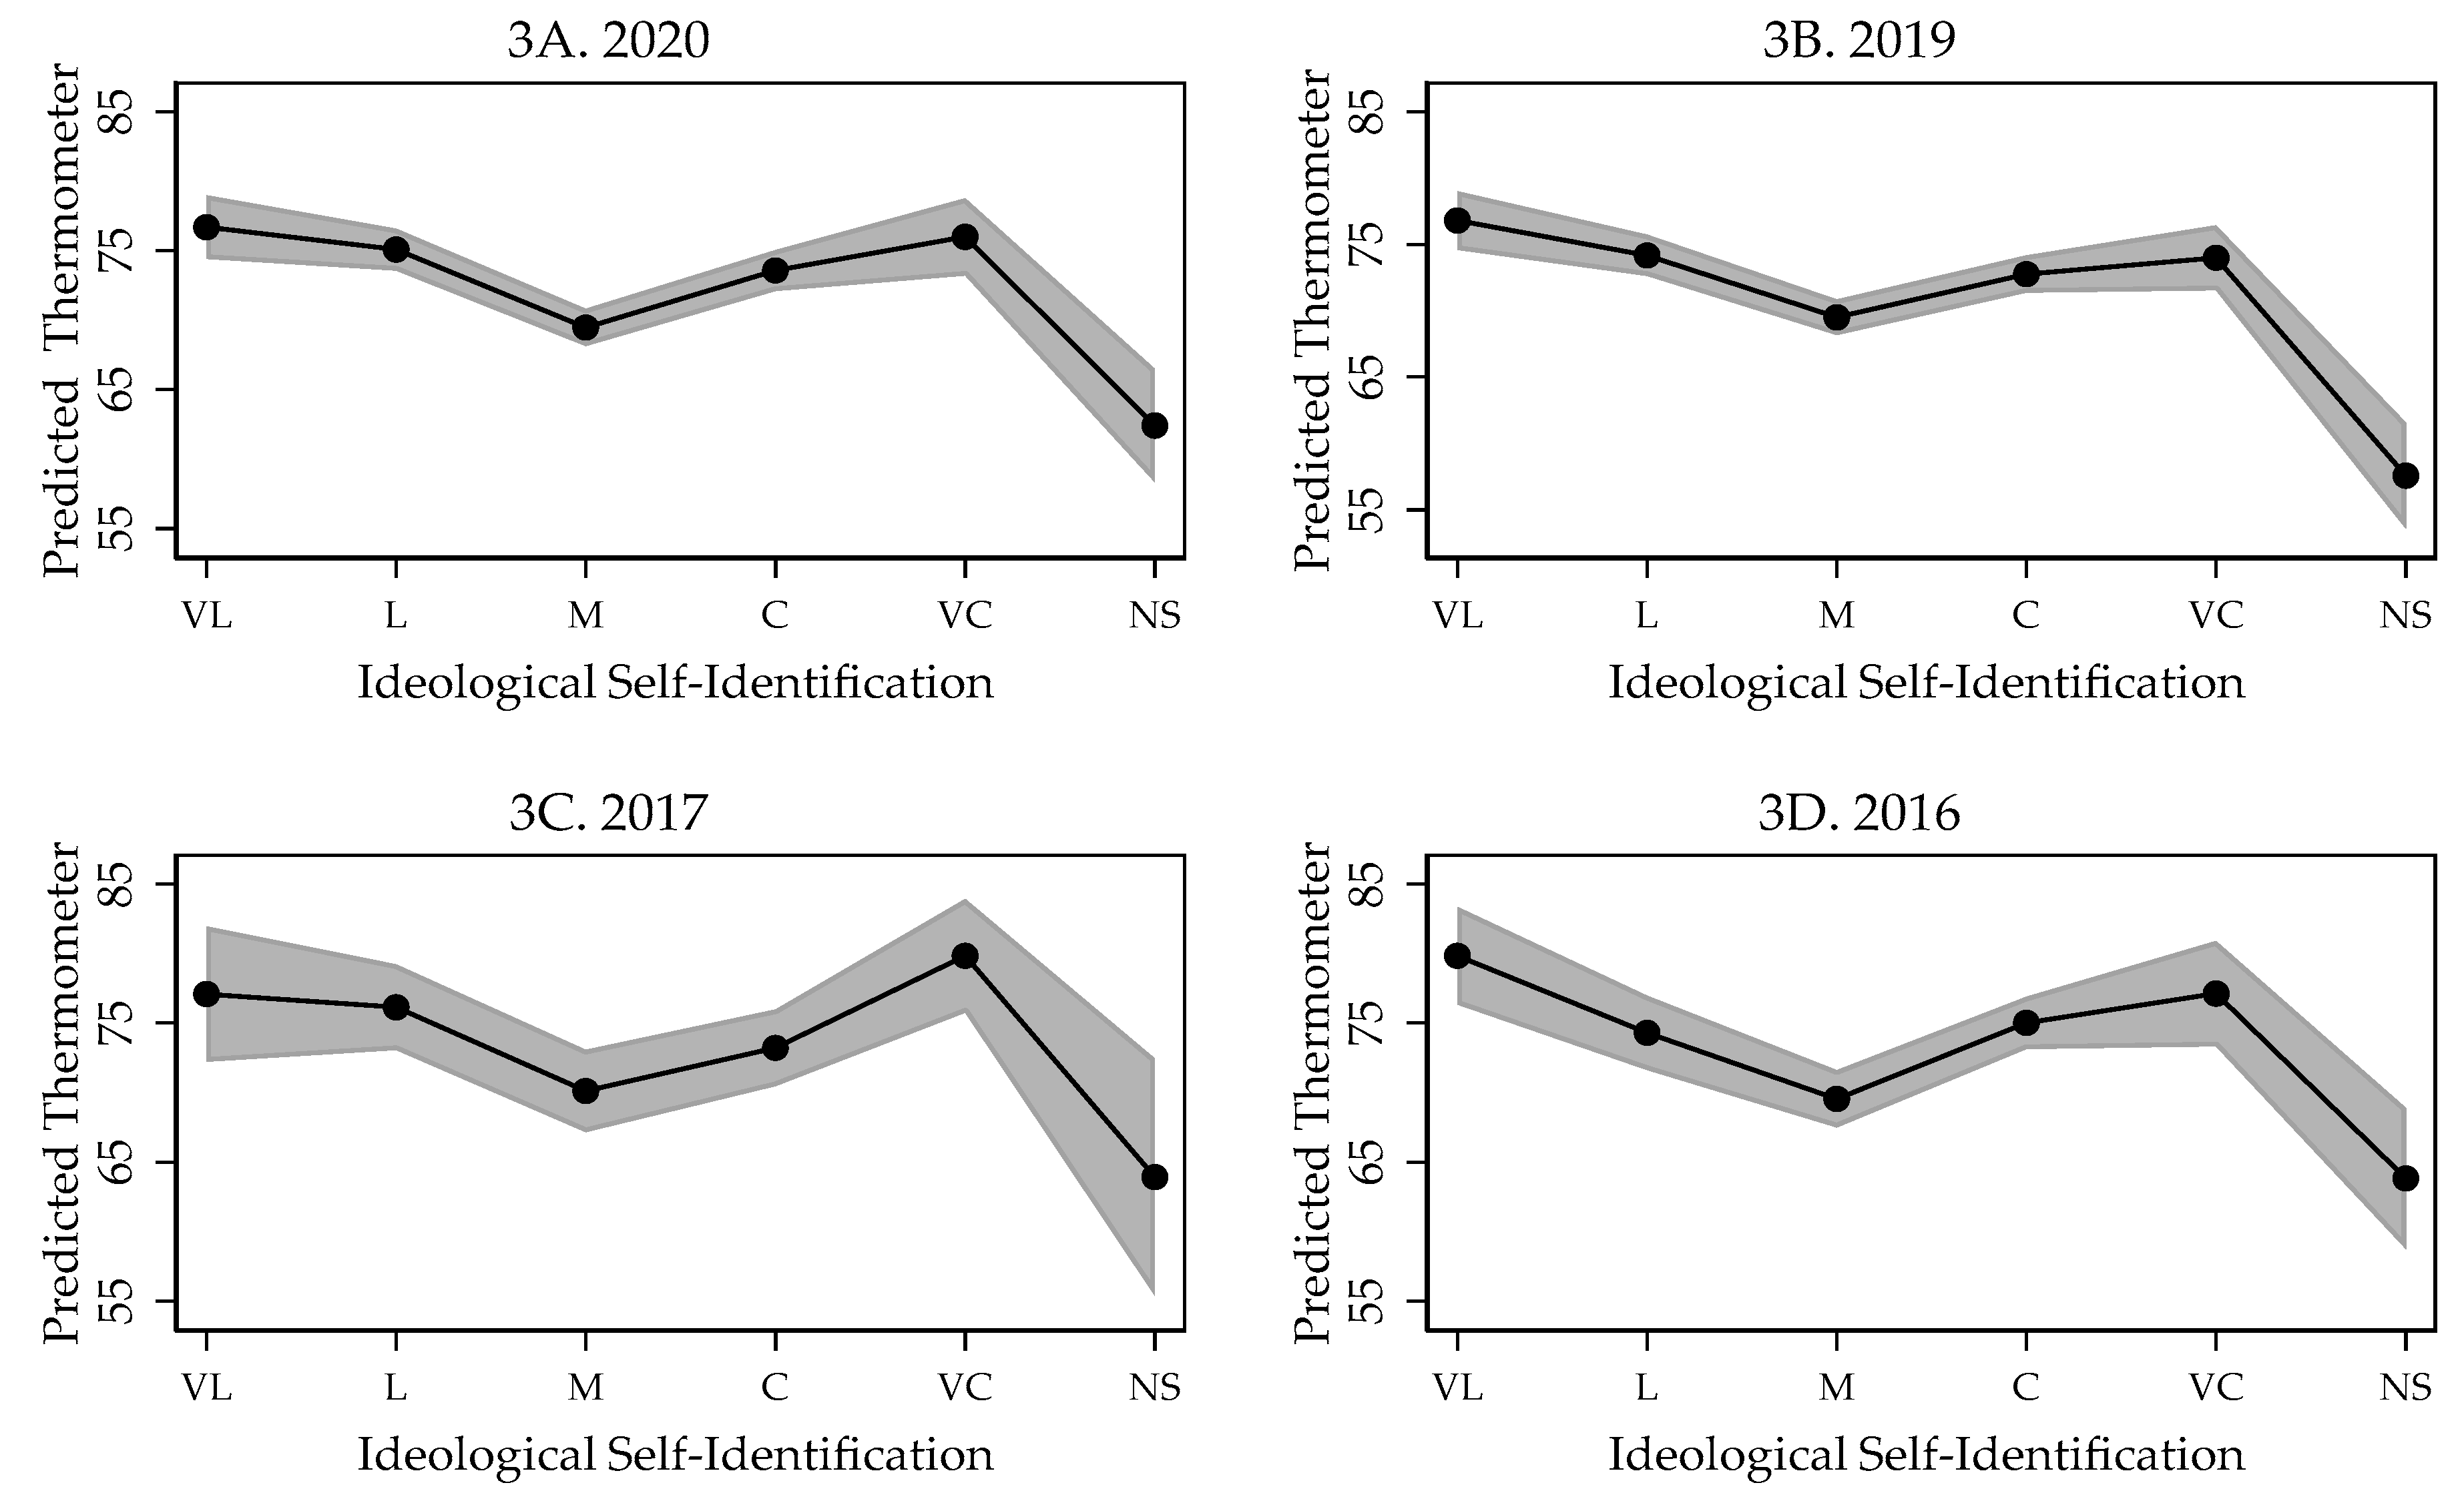
Figure 3 presents the marginal effects plots of ideology on the feeling thermometer toward Jews using the VSG data for the four years. Appendix A Table A3 presents the detailed regression results. VSG employs the five-category ideology question, including the “Not Sure” option, like Nationscape, while attitudes toward Jews are measured with a feeling thermometer, like ANES.
Results again provide support for the key hypotheses. Very liberal and very conservative respondents have the warmest ratings toward Jews, followed by liberals and conservatives, and then moderates with cooler, albeit still on net warm ratings. “Not Sure” respondents have cooler ratings than moderates, yet “Not Sure” respondents are warm toward Jews, with ratings above 55 degrees for all years. Table 2 presents results of the F tests for several comparisons. For every year, there is a statistically significant difference in warmth between very liberal and very conservative with moderate respondents. There is a statistically significant difference in ratings between moderates and “Not Sure” in all years but 2017. Finally, repeating the above findings, the warmth ratings of very liberal and very conservative respondents are not statistically significantly different.
5.4. Hersh-Royden Data
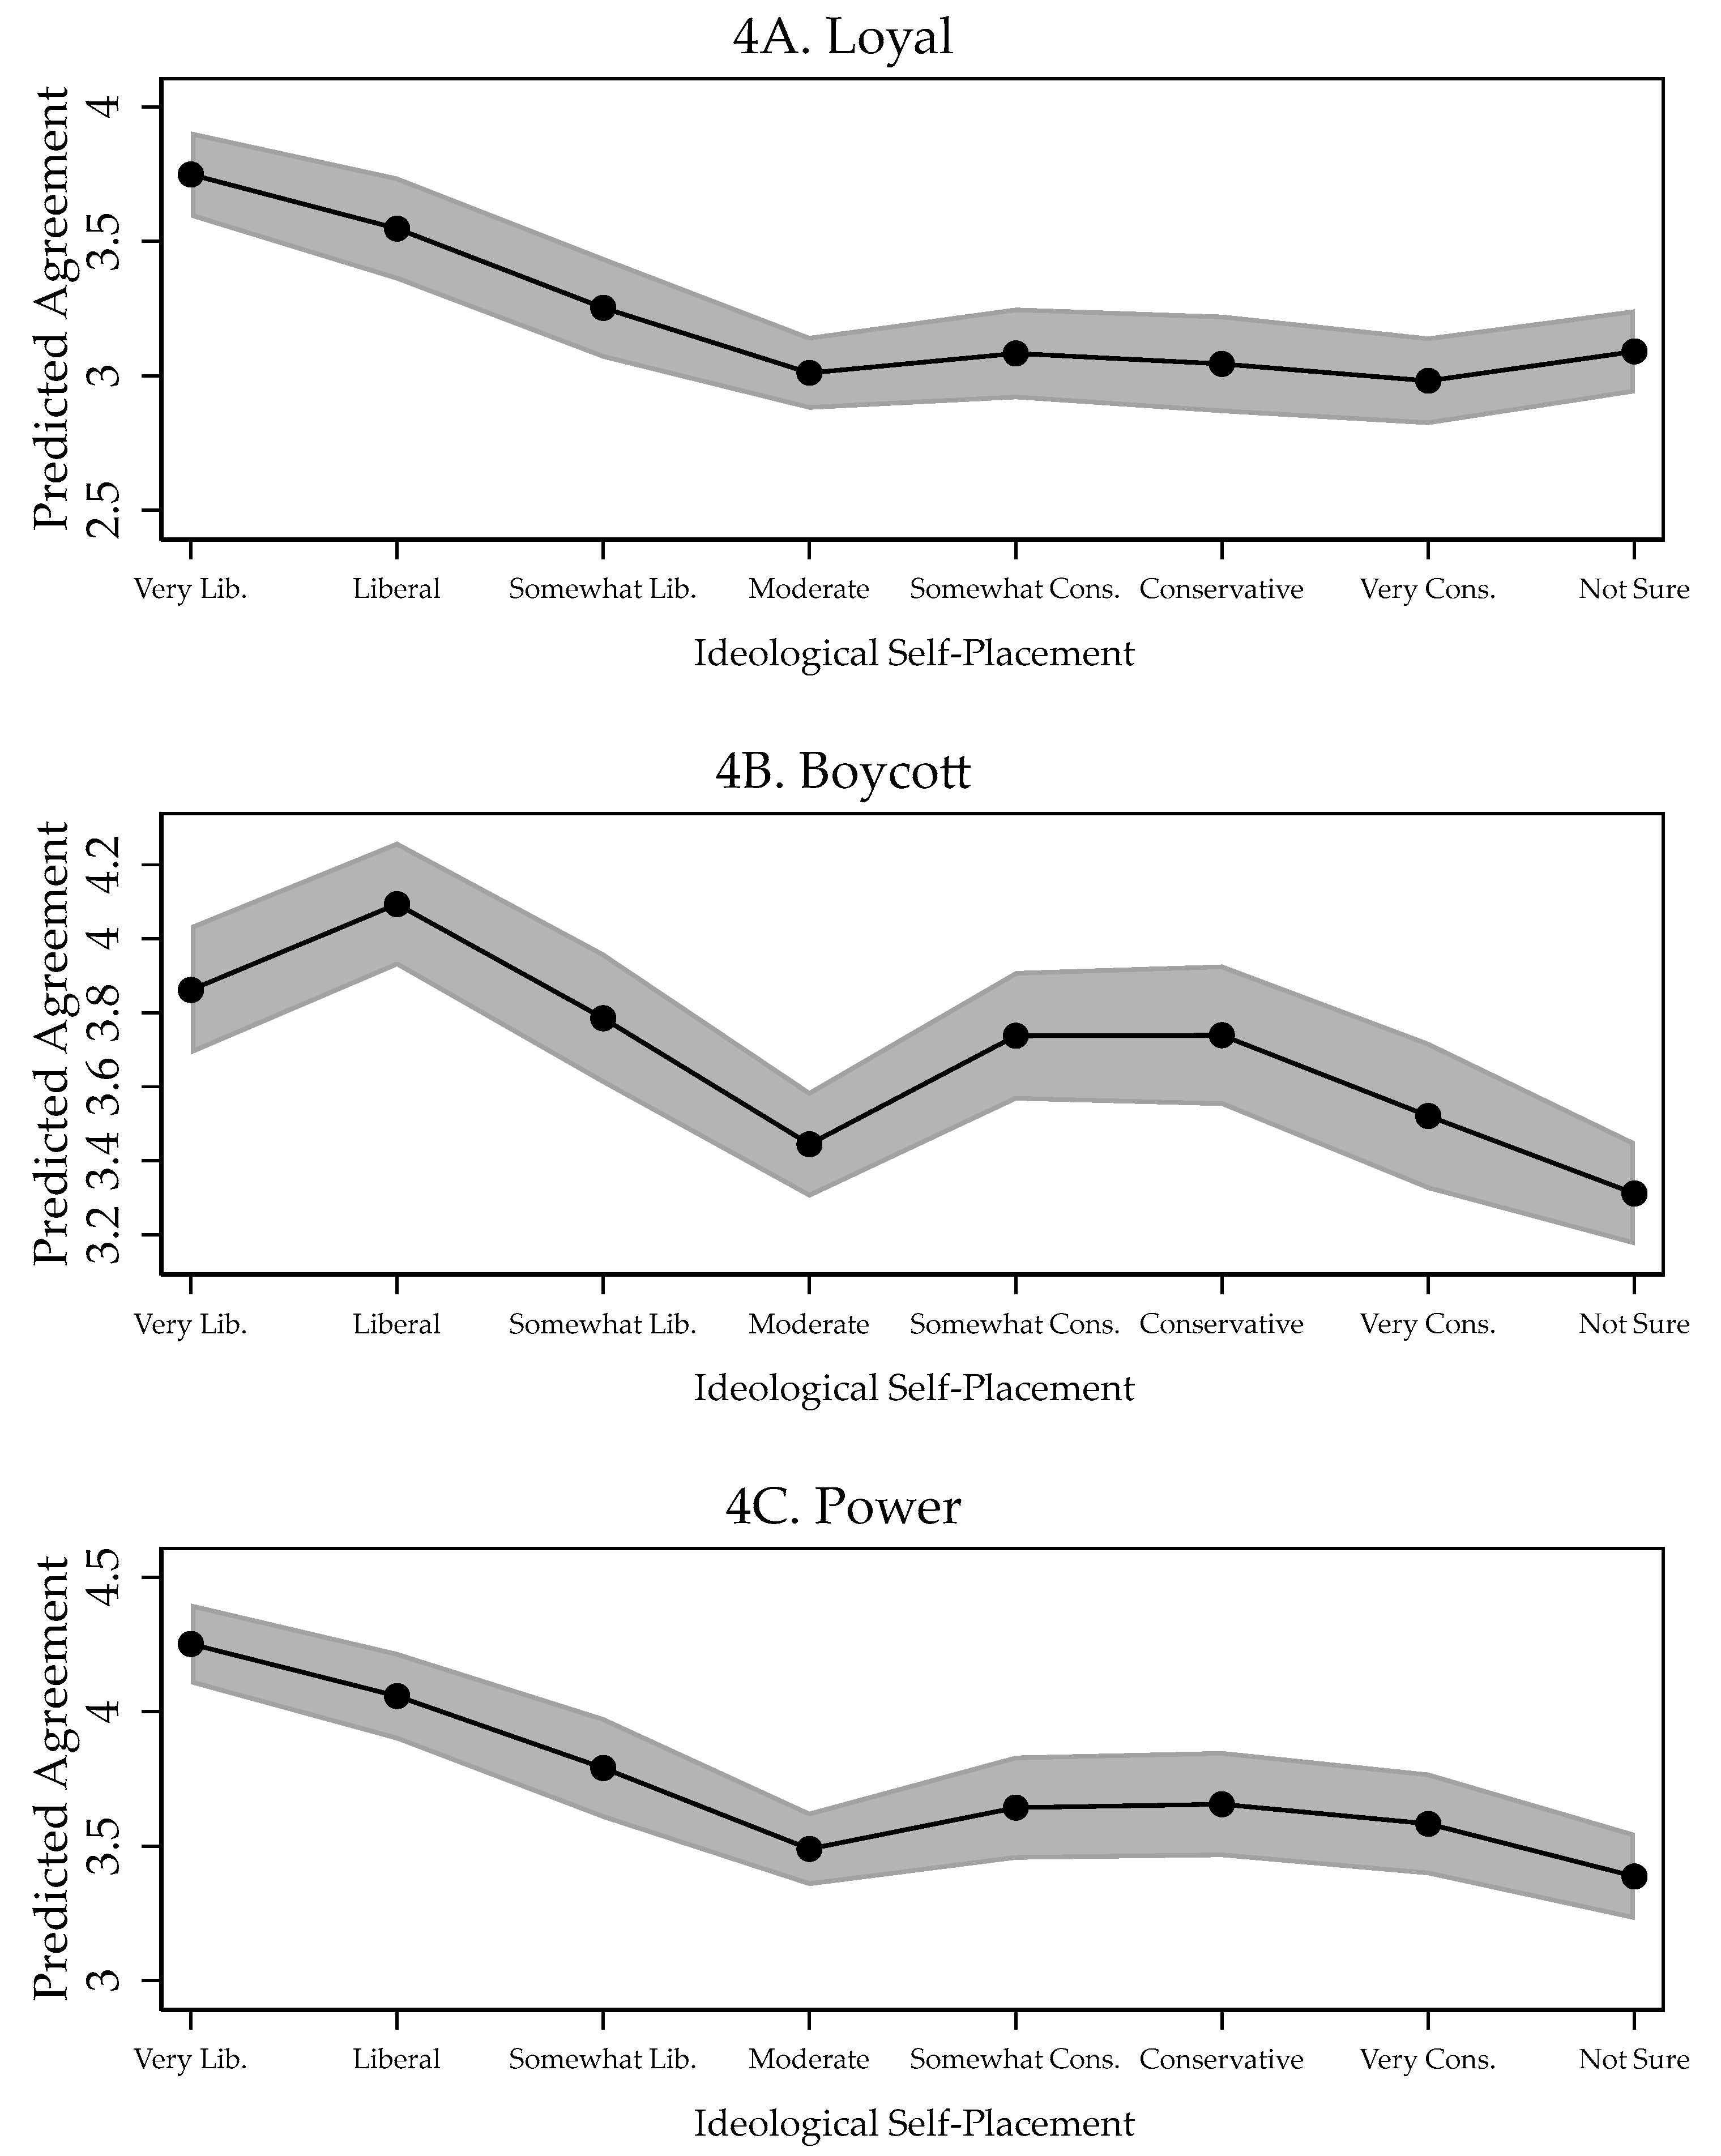
Figure 4 presents the marginal effects plot of ideological self-placement on agreement with statements about Jews using the Hersh-Royden data. The dependent variable is scored from “1” for strongly agree to “5” for strongly disagree; high scores indicate greater support-positivity toward Jews. Regression results are presented in Appendix A Table A4.
Visually, there is little support for the mainstream philosemitism hypotheses using the Hersh-Royden data. For loyalty, the highest support for Jews is among liberals. Support is lower among moderates than liberals. However, from moderates through the very conservative and the “Not Sure,” support levels are flat and unvarying. A similar story appears for the Jewish Power question, although there is a slight increase in support for Jews from moderate to somewhat conservative and conservative categories. However, support declines for very conservative and “Not Sure” respondents. For the boycott question, there is a modest rise in support for Jews from very liberal to liberal, and then the hypothesized decline in support moving toward moderates. From moderates to somewhat conservative and conservative, support for Jews ticks up, but declines with the very conservative, and bottoms with “Not Sure” respondents. Visually, the Hersh-Royden data provide support for the right-wing hypothesis.
Table 3 presents F tests comparing the differences between several pairs of ideological positions and attitudes toward Jews for the Hersh-Royden data. The only consistently statistically significant F test comparison is between very liberal and moderate—very liberal individuals are statistically significantly more supportive of Jews than moderates. Also, very liberal respondents are statistically significantly more positive toward Jews than very conservative respondents for all three questions, which supports the right-wing hypothesis.
One factor that may account for the difference in findings between Hersh-Royden data from the ANES, Nationscape, and VSG data is that Hersh-Royden employs specific questions, while the others use general questions regarding Jews, such as feeling thermometers and favorability. The UAS data include both specific and general questions on attitudes towards Jews, allowing a further test of question wording differences. The next section turns to the UAS data.
5.5. UAS 2015 Data
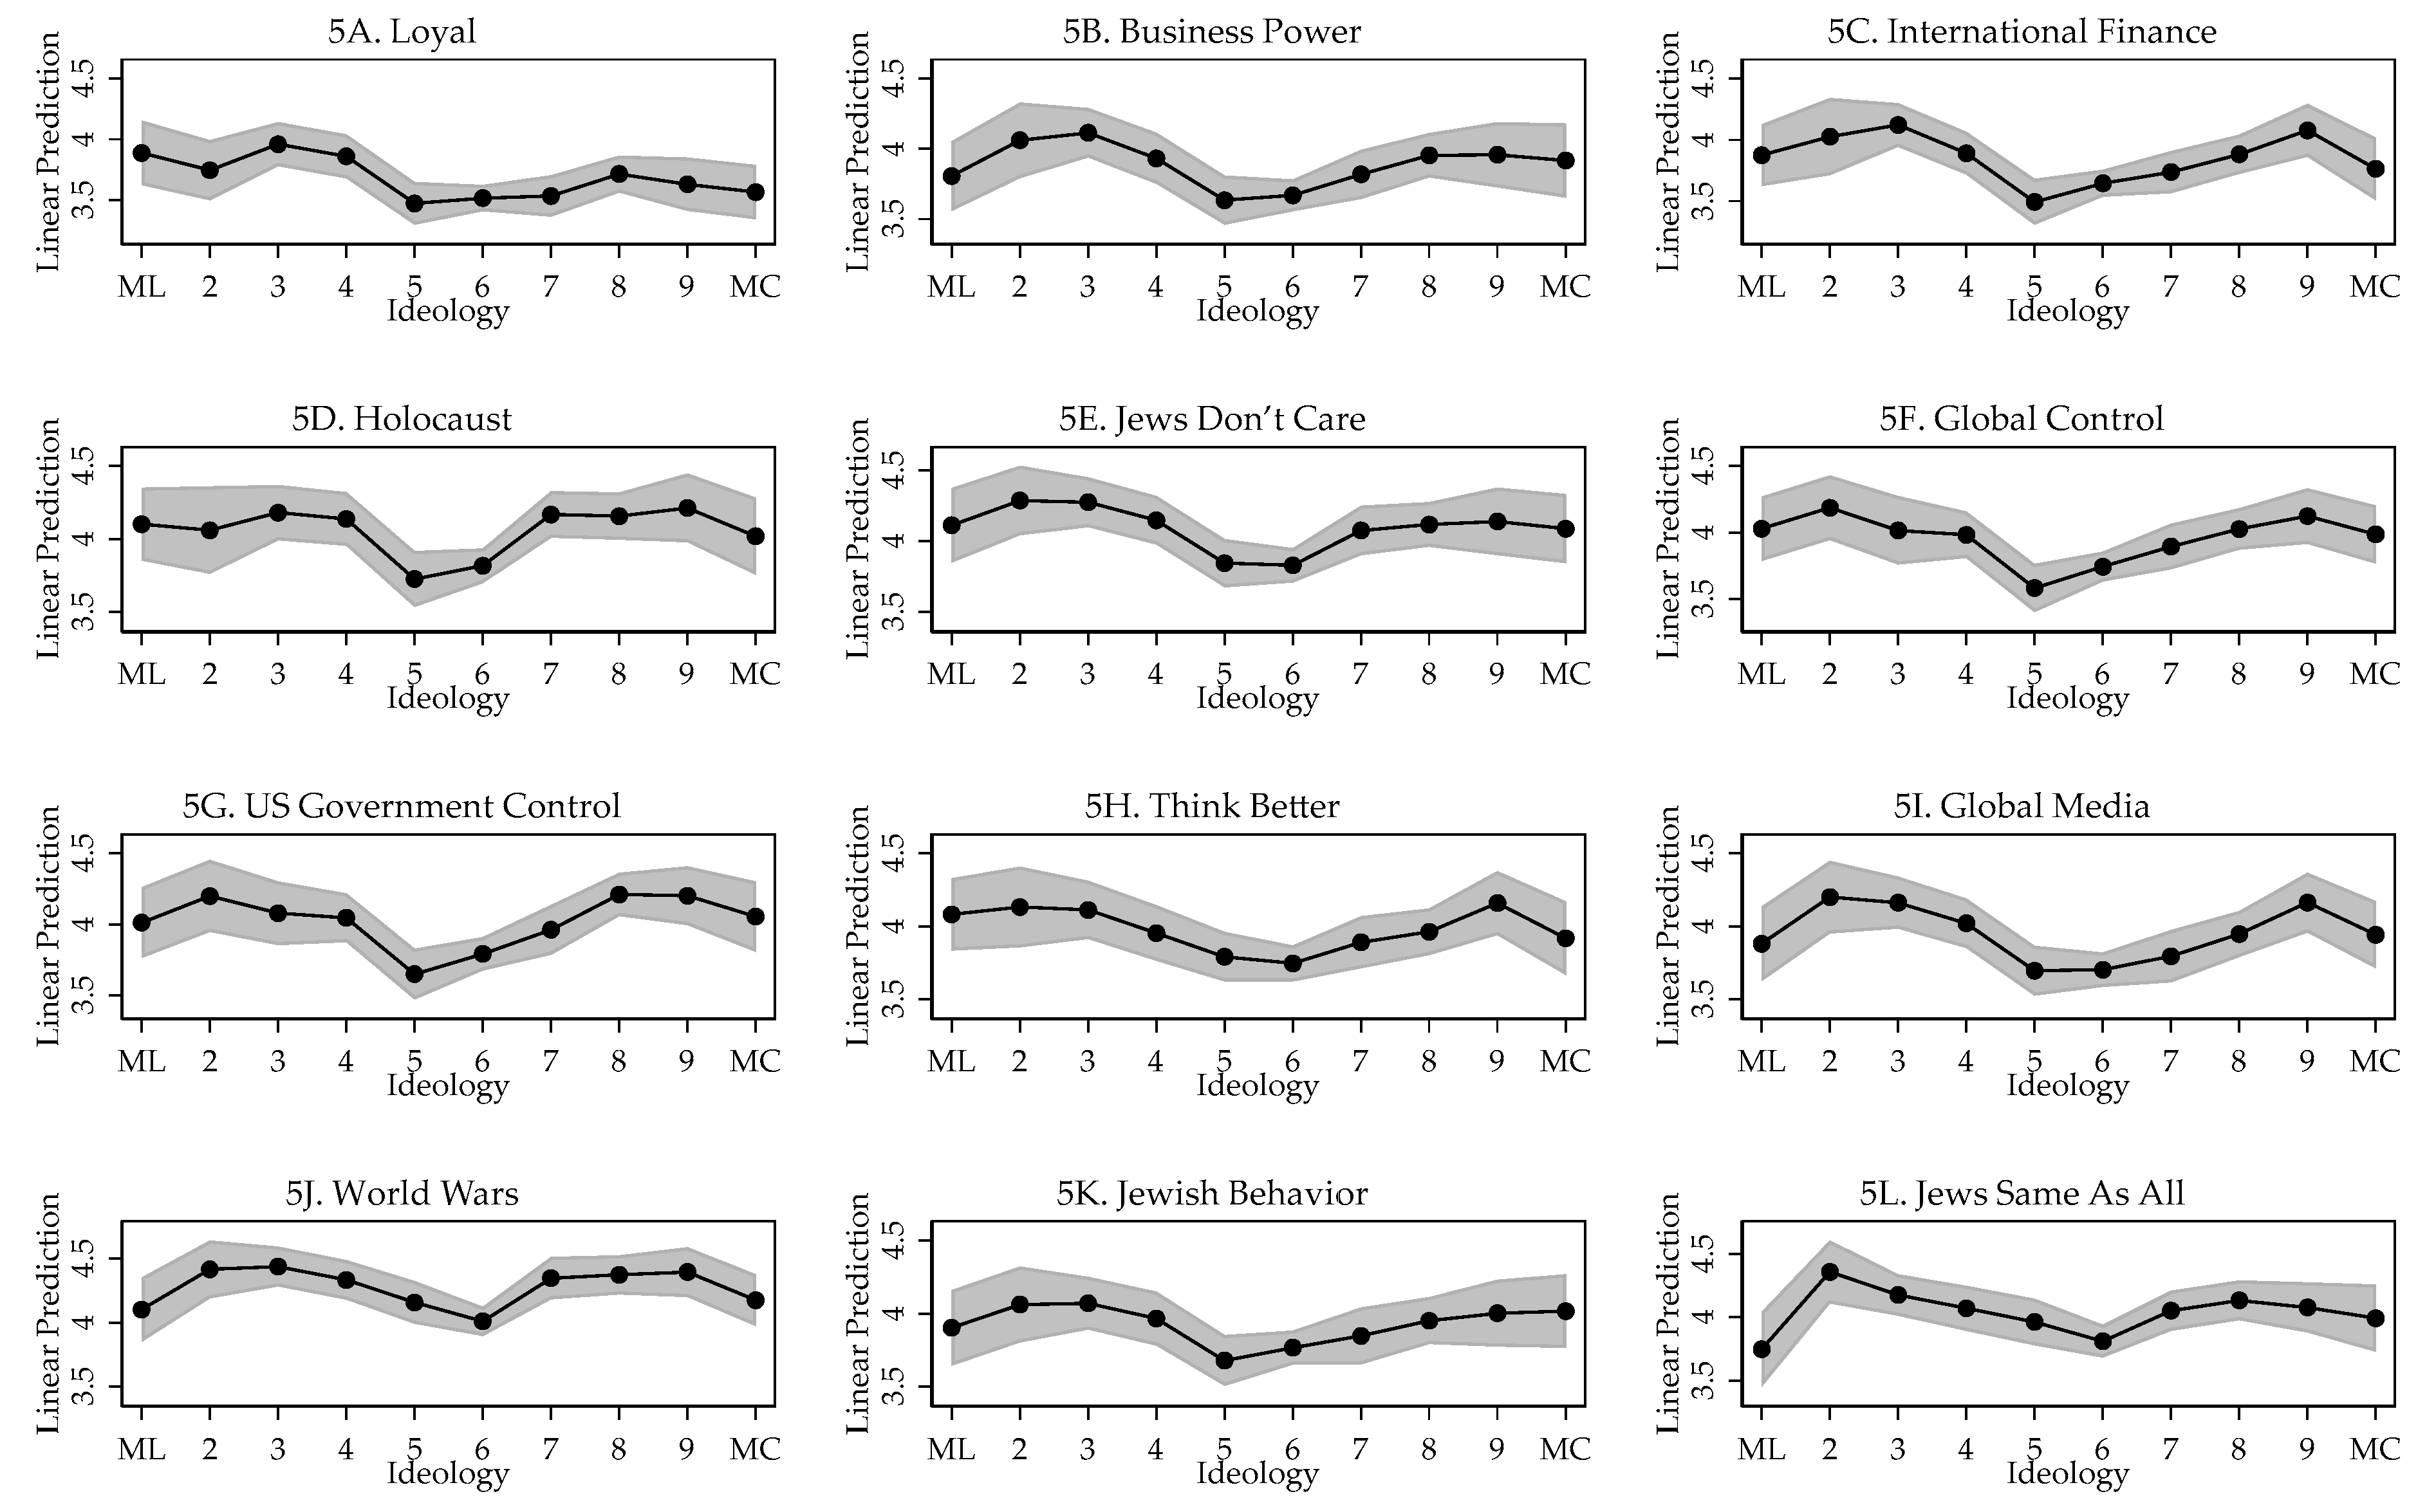
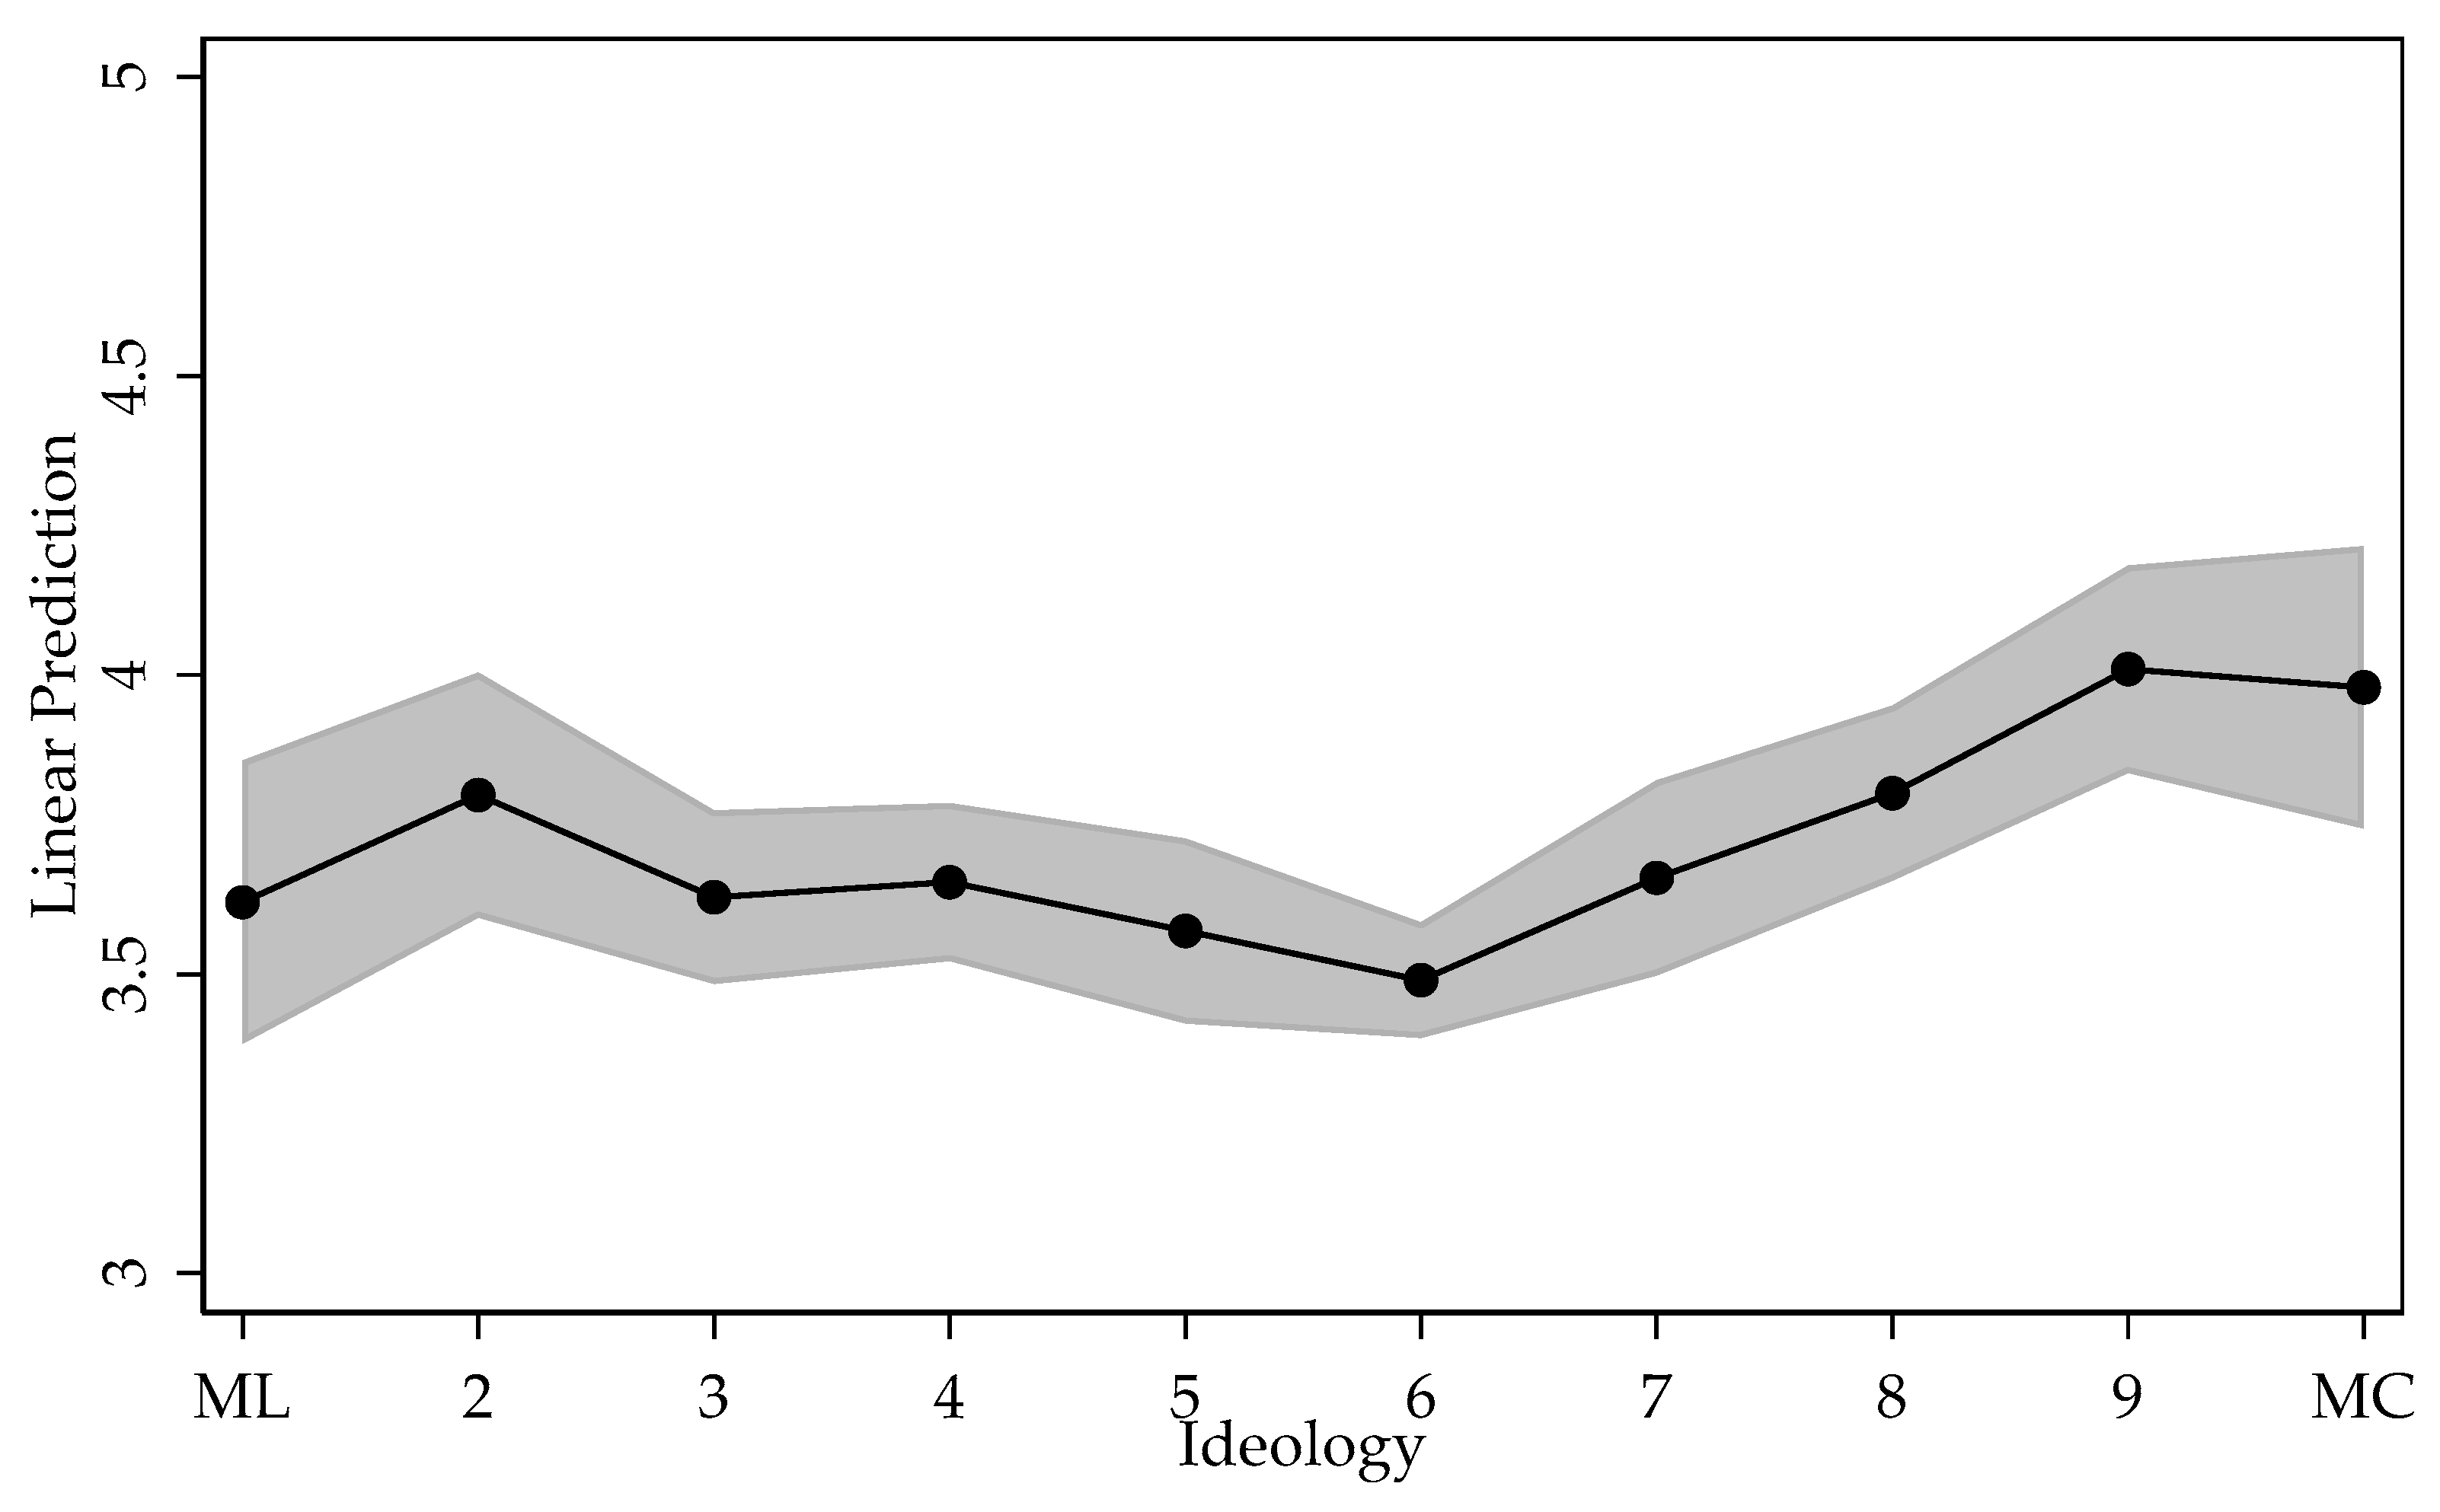
Figure 5 and Figure 6 present results using the UAS data. Detailed statistical results are reported in Appendix A Table A5A–C. Figure 5 presents the plots for questions that ask about specific traits or behaviors of Jews, while Figure 6 plots the relationship between ideology and favorability toward Jews. An important limitation of the UAS data is that the ideology question does not allowed respondents to select “Not Sure” or “Don’t Know”. Recall, ideological self-placement is measured on a 10-point scale from Very Liberal to Very Conservative (ML and MC on the figure).
Turning first to Figure 5, a U-shaped pattern is evident for 11 of the 12 questions, with liberals and conservatives displaying warmer attitudes towards Jews than moderates. Moderates are defined as those who place themselves at 5 or 6 on the ideology scale. The Jewish loyalty question (see Figure 5A) is consistent with the right-wing hypothesis, with greater warmth among liberals than conservatives, although moderates appear cooler toward Jews than liberals, but comparable in warmth to conservatives. Hersh-Royden, who also used this question, also found support for the right-wing hypothesis. The favorability question (Figure 6) shows the dip in favorability among moderates compared to liberals and conservatives. On this question, conservatives appear to have stronger favorability scores that liberals.
As before, we can test formally the differences in attitudes between liberals-moderates and conservatives-moderates with F tests. Table 4 presents F test results between liberals (9) and moderates (6), conservatives (2) and moderates (5), and liberals (9) and conservatives (2). The numbers in parentheses are the ideological locations used for the F tests. The most extreme values for liberals and conservatives are not used for these tests since those categories may mix extreme with very liberal (conservative) respondents. Further, the extreme values for liberals (10) and conservatives (1) are used to test the extremist hypothesis that extremists will be less positive toward Jews than mainstream liberals and conservatives. Figure 5 and Figure 6 show in many instances lower positivity toward Jews among those located at liberal (10) or conservative (1) than liberal (9) and conservative (2). Below a formal test of the extremist hypothesis is presented. Finally, since there is no numerical or identified midpoint for moderates, the tests use the middle positions closer to the liberal/conservative poles.
The F test results show that for all variables except for Jewish loyalty, there is a significant difference between liberals and moderates, using a p-value of 0.05 at the standard. Results are less strong for the conservative-moderate comparisons, but still suggest strong support for the mainstream philosemitism hypothesis. For nine of the 13 measures of attitudes towards Jews, there is a significant difference between conservatives (2) and moderates (5). In all instances, the F tests have p-value less than 0.10. The last part of the philosemitic hypothesis is that there should be no difference in attitudes toward Jews between liberals and conservatives. This is what we find, with all p-values for the F tests greater than 0.05 and only one less than 0.01 (Jews are like everyone else). These results provide strong support for the mainstream philosemitism hypothesis for 12 attitudes toward Jews. The mainstream philosemitism hypothesis fails only the Jewish loyalty question, and even here, support for the right-wing hypothesis is weak, as there is no significant difference in the attitudes of conservatives and liberals.
6. The Dimensionality of Attitudes toward Jews in the U.S.
The UAS data suggest that question wording may affect attitudes toward Jews: Different questions may evoke different images and/or stereotypes about Jews, leading to different responses. Table 5 and Table 6 present results of a factor analysis of the 13 items from the UAS data.12 All 13 items load on one factor. The only eigenvalue greater than 1 is for factor 1 (see Table 4). Table 5 shows the factor loadings for each item for factors 1–5. In every case, each item loads most heavily on factor 1. Most factor loadings on factor 1 are greater than 0.70, which is close to the maximum of 1. Two variables, Jews same (Jews are like everyone else) and favorability, have factor loadings of 0.40 and 0.47, respectively. Although still strong, these factor loadings are significantly weaker than for the other 11 items. One reason for the weaker loadings of these two variables might be less variance in attitudes toward Jews than found for the other variables.13 Finally, the Jewish loyalty question, which showed support for the right-wing hypothesis, still loads quite strongly with the other variables loaded on factor 1 at 0.71. This suggests minor variations in question wording can evoke different images and stereotypes about Jews, a topic that deserves greater research attention for measuring attitudes toward Jews.
7. Political Extremism and Attitudes toward Jews in the U.S.
The UAS data provide an opportunity to test the extremism hypothesis that extremists on the right and left will be less positive toward Jews than mainstream conservatives and liberals, because compared to the other measures of ideological self-placement, the UAS has a 10-point scale. Still, there are two limitations of this ideological scale to test the extremism hypothesis. First, the UAS does not offer respondents a “Don’t Know” category. Other studies find from 20–40% of respondents have difficulty self-locating on an ideology scale. We do not know where true “Don’t Know” respondents located themselves on the UAS scale. Second, UAS labels for respondents the most extreme categories, liberals (10) and conservative (1), very liberal and very conservative. These “extreme” categories may mix true extremists from very liberal (conservative) respondents. Table 7 presents F test results between the two most extreme liberal (9, 10) and conservative categories (1 and 2).
Results indicate little support for the extremism hypothesis. For liberals, all F tests surpass the 0.05 standard for statistical significance. Only the item on Jewish control of international finance approaches significance, with a p-value of 0.06. For conservatives, only one question, Jews same (Jews are like everyone else), shows a statistically significant difference between the two types of conservatives; for all other questions there is no statistically significant difference between the two sets of conservatives. These findings should not be read as a lack of support for the extremism hypothesis, but rather that the ideological variable is not sufficient for testing the hypothesis.
8. Conclusions
This paper investigated the link between ideology and antisemitic attitudes in the U.S., employing five sets of surveys and nearly two dozen question administrations. Historical research suggests antisemitism on both the far-right and far-left; that research focuses on political elites and ideology. Research on mass publics in western societies, in contrast, finds antisemitism located primarily on the political right. This paper argues there are several limitations of existing research on antisemitism in western mass publics. One, respondent ideology, measured as ideological self-identification, cannot distinguish between individuals who are very liberal (conservative) from extremists of the left and right. Two, existing theory is not strongly rooted in theories of mass opinion formation. Three, existing theories cannot account for the transformation of elites from being strongly antisemitism in the mid-twentieth century to now being stalwartly philosemitic. Four, it is not clear which is (are) the best measures of antisemitic opinion in mass publics.
This paper offers a theory based on the learning of tolerance norms and information flow from elites to average citizens and outlines an account of the transformation of elite opinion from being antisemitic to philosemitic. The theory, mainstream philosemitism, suggests new hypotheses, with the major ones suggesting that mainstream liberals and conservatives in the mass public will evince lower levels of antisemitic opinion than moderates and individuals without a sense of ideological self-identification. Further the theory allows for the possibility that extremists of the right and left will be more antisemitic than mainstream liberals and conservatives. These hypotheses are tested using five data sets with nearly two dozen questions measuring attitudes toward Jews. Results overwhelming support the mainstream philosemitism theory.
Still, this research raises several questions for future analyses. First, the type of question used to measure attitudes towards Jews may matter. Thirteen questions from the Understanding America Survey (USA) loaded on a single dimension, the impact of ideology varied across question, although most were consistent with the mainstream philosemitic hypotheses. More work needs to be performed to measure anti-Jewish attitudes, a difficult problem since such attitudes may vary across time and place, and different questions may evoke varying images and stereotypes of Jews (Allington and Hirsh 2019; Staetsky 2020, 2021; Levin et al. 2022).
Second, standard ideological self-placement questions may not distinguish between extremists and mainstream conservatives and liberals, even those who identify as “strongly” or “very” conservative or liberal. Even the UAS question, with 10 categories, labels the anchoring categories “very”. Such a label may lead mainstream liberals and conservatives to select that category, along with individuals who hold more extreme ideology orientations. More work needs to be performed to create a measure of ideological self-placement that effectively discriminates mainstream liberals and conservatives, who happen to be decidedly and strongly liberal or conservative, from individuals with more extreme views that sit outside of what most people would consider to be mainstream beliefs.
Third, the empirical research in this paper only investigated the relationship between ideology and antisemitic beliefs in the U.S., mostly from the mid-2010s to the present. Additional research should be expanded, as much as possible, to earlier times in the U.S., which may be possible because there are some data sources that date earlier. Plus, similar research should be conducted on countries besides the U.S. For instance, the European Social Survey used in Cohen (2018a) and the large, cross national World Values (and European Values) surveys contain items on ideological self-placement and attitudes towards Jews, as well as conducting new surveys both for the U.S. and other nations. These suggestions indicate a healthy amount of future research.
Funding
This research received no external funding.
Institutional Review Board Statement
Not applicable.
Informed Consent Statement
Not applicable.
Data Availability Statement
All data for this research are publicly available. Upon publication, the data and analysis codes will be posted on the Harvard Dataverse.
Conflicts of Interest
The author declares no conflicts of interest.
Appendix A. Regression Results for Constructing the Figures in the Paper

Table A1.
Impact of Ideological Self-Placement on Attitudes Toward Jews: ANES, 1972–2020.
| (1) | |
|---|---|
| Feeling Thermometer (VCF0205) | |
| Extremely Liberal | 8.69 *** |
| (1.66) | |
| Liberal | 6.44 *** |
| (1.45) | |
| Slightly Liberal | 1.45 |
| (1.1) | |
| Moderate (reference category) | --- |
| Slightly Conservative | −0.2 |
| (0.58) | |
| Conservative | 4.12 *** |
| (0.75) | |
| Extremely Conservative | 7.53 *** |
| (0.95) | |
| DK | −4.39 *** |
| (0.7) | |
| Constant | 65.52 *** |
| (1.39) | |
| Observations | 22,788 |
| R-squared | 0.03 |
Standard errors are in parentheses. *** p < 0.01. Clustered on year of survey. Regression using ideology expressed as factor variables, with “Moderate” serving as the reference category.
Table A2.
Impact of Ideological Self-Placement on Attitudes Toward Jews: Nationscape.
| (1) | (2) | |
|---|---|---|
| Favorability (5 Category) | Favorability (4 Category) | |
| Very Liberal | 0.22 *** | 0.15 *** |
| (0.01) | (0.01) | |
| Liberal | 0.19 *** | 0.12 *** |
| (0.01) | (0.01) | |
| Moderate (reference category) | --- | --- |
| Conservative | 0.11 *** | 0.07 *** |
| (0.01) | (0.01) | |
| Very Conservative | 0.21 *** | 0.15 *** |
| (0.01) | (0.01) | |
| Not Sure | −0.44 *** | −0.2 *** |
| (0.01) | (0.01) | |
| Constant | 3.81 *** | 3.17 *** |
| (0.01) | (0.01) | |
| Observations | 334,474 | 265,376 |
| R-squared | 0.03 | 0.01 |
Standard errors are in parentheses. *** p < 0.01. Clustered on week of survey. Regression using ideology expressed as factor variables, with “Moderate” serving as the reference category.
Table A3.
Impact of Ideological Self-Placement on Attitudes Toward Jews: VSG Feeling Thermometer.
| (1) | (2) | (3) | (4) | |
|---|---|---|---|---|
| September 2020 | November 2019 | 2017 | 2016 | |
| Very Liberal | 7.22 *** | 7.3 *** | 6.98 ** | 10.3 *** |
| (1.35) | (1.31) | (2.91) | (2.08) | |
| Liberal | 5.61 *** | 4.67 *** | 6.03 *** | 4.75 *** |
| (1.02) | (1.04) | (2.18) | (1.72) | |
| Moderate (reference) | --- | --- | --- | --- |
| Conservative | 4.1 *** | 3.26 *** | 3.1 | 5.47 *** |
| (1.01) | (0.99) | (2.06) | (1.42) | |
| Very conservative | 6.52 *** | 4.48 *** | 9.73 *** | 7.57 *** |
| (1.57) | (1.42) | (2.57) | (2.2) | |
| Not sure | −7.06 *** | −11.92 *** | −6.19 | −5.73 ** |
| (2.18) | (2.14) | (4.6) | (2.79) | |
| Constant | 69.47 *** | 69.51 *** | 70.11 *** | 69.54 *** |
| (0.68) | (0.68) | (1.51) | (1.05) | |
| Observations | 5397 | 5359 | 4693 | 7500 |
| R-squared | 0.02 | 0.03 | 0.03 | 0.03 |
Standard errors are in parentheses. *** p < 0.01, ** p < 0.05. Regression using ideology expressed as factor variables, with “Moderate” serving as the reference category.
Table A4.
Impact of Ideological Self-Placement on Attitudes Toward Jews: Hersh-Royden Data.
| (1) | (2) | (3) | |
|---|---|---|---|
| Loyal | Boycott | Power | |
| (q18) | (q19) | (q20) | |
| Very Liberal | 0.74 *** | 0.42 *** | 0.76 *** |
| (0.11) | (0.12) | (0.1) | |
| Liberal | 0.54 *** | 0.65 *** | 0.57 *** |
| (0.12) | (0.11) | (0.11) | |
| Somewhat Liberal | 0.24 ** | 0.34 *** | 0.3 ** |
| (0.12) | (0.12) | (0.12) | |
| Moderate (reference category) | --- | --- | --- |
| Somewhat Conservative | 0.07 | 0.29 ** | 0.15 |
| (0.11) | (0.12) | (0.12) | |
| Conservative | 0.03 | 0.29 ** | 0.17 |
| (0.12) | (0.12) | (0.12) | |
| Very Conservative | −0.03 | 0.08 | 0.09 |
| (0.11) | (0.13) | (0.12) | |
| Not Sure | 0.08 | −0.13 | −0.1 |
| (0.11) | (0.1) | (0.11) | |
| Constant | 3.01 *** | 3.44 *** | 3.49 *** |
| (0.07) | (0.07) | (0.07) | |
| Observations | 3403 | 3403 | 3404 |
| R-squared | 0.06 | 0.04 | 0.06 |
Standard errors are in parentheses. *** p < 0.01, ** p < 0.05. Regressions using ideology expressed as factor variables, with “Moderate” serving as the reference category.
Table A5.
(A) Impact of Ideological Self-Placement on Attitudes toward Jews: UAS 2015 Data. (B) Impact of Ideological Self-Placement on Attitudes toward Jews: UAS 2015 Data. (C) Impact of Ideological Self-Placement on Attitudes toward Jews: UAS 2015 Data.
Table A5.
(A) Impact of Ideological Self-Placement on Attitudes toward Jews: UAS 2015 Data. (B) Impact of Ideological Self-Placement on Attitudes toward Jews: UAS 2015 Data. (C) Impact of Ideological Self-Placement on Attitudes toward Jews: UAS 2015 Data.
| (A) | |||||
| (1) | (2) | (3) | (4) | ||
| Loyal | Business Power | International Financial Power | Holocaust | ||
| Most Liberal | 0.42 ** | 0.17 | 0.38 ** | 0.38 ** | |
| (0.16) | (0.15) | (0.16) | (0.16) | ||
| 2 | 0.27 * | 0.43 *** | 0.53 *** | 0.33 * | |
| (0.15) | (0.16) | (0.19) | (0.18) | ||
| 3 | 0.49 *** | 0.48 *** | 0.63 *** | 0.45 *** | |
| (0.13) | (0.13) | (0.13) | (0.14) | ||
| 4 | 0.39 *** | 0.3 ** | 0.4 *** | 0.41 *** | |
| (0.13) | (0.13) | (0.13) | (0.13) | ||
| 5 (reference category) | |||||
| 6 | 0.04 | 0.03 | 0.15 | 0.09 | |
| (0.1) | (0.11) | (0.11) | (0.11) | ||
| 7 | 0.06 | 0.18 | 0.24 * | 0.44 *** | |
| (0.12) | (0.13) | (0.13) | (0.13) | ||
| 8 | 0.24 ** | 0.32 *** | 0.39 *** | 0.43 *** | |
| (0.12) | (0.12) | (0.12) | (0.13) | ||
| 9 | 0.16 | 0.32 ** | 0.58 *** | 0.49 *** | |
| (0.14) | (0.15) | (0.14) | (0.15) | ||
| Most Conservative | 0.09 | 0.28 * | 0.27 * | 0.29 * | |
| (0.14) | (0.16) | (0.16) | (0.17) | ||
| Constant | 3.47 *** | 3.63 *** | 3.49 *** | 3.73 *** | |
| (0.09) | (0.09) | (0.1) | (0.1) | ||
| Observations | 1456 | 1457 | 1457 | 1455 | |
| R-squared | 0.03 | 0.02 | 0.03 | 0.02 | |
| (B) | |||||
| (1) | (2) | (3) | (4) | ||
| Don’t Care | Control Global | Control US Govt. | Think Better | ||
| Most Liberal | 0.27 * | 0.45 *** | 0.36 ** | 0.29 * | |
| (0.16) | (0.15) | (0.16) | (0.15) | ||
| 2 | 0.44 *** | 0.6 *** | 0.55 *** | 0.34 ** | |
| (0.15) | (0.15) | (0.16) | (0.17) | ||
| 3 | 0.43 *** | 0.43 *** | 0.43 *** | 0.32 ** | |
| (0.12) | (0.16) | (0.15) | (0.13) | ||
| 4 | 0.3** | 0.4 *** | 0.4 *** | 0.16 | |
| (0.12) | (0.13) | (0.13) | (0.13) | ||
| 5 (reference category) | |||||
| 6 | −0.02 | 0.16 | 0.14 | −0.05 | |
| (0.11) | (0.11) | (0.11) | (0.11) | ||
| 7 | 0.23 * | 0.31 ** | 0.31 ** | 0.1 | |
| (0.12) | (0.13) | (0.13) | (0.12) | ||
| 8 | 0.27 ** | 0.45 *** | 0.56 *** | 0.17 | |
| (0.12) | (0.12) | (0.12) | (0.12) | ||
| 9 | 0.29 ** | 0.54 *** | 0.55 *** | 0.37 *** | |
| (0.15) | (0.14) | (0.14) | (0.14) | ||
| Most Conservative | 0.24 | 0.4 *** | 0.4 *** | 0.13 | |
| (0.15) | (0.14) | (0.16) | (0.15) | ||
| Constant | 3.85 *** | 3.58 *** | 3.65 *** | 3.79 *** | |
| (0.09) | (0.09) | (0.09) | (0.09) | ||
| Observations | 1457 | 1455 | 1455 | 1455 | |
| R-squared | 0.02 | 0.03 | 0.03 | 0.02 | |
| (C) | |||||
| (1) | (2) | (3) | (4) | (5) | |
| Global Media Control | Wars | Behavior | Jews Same | Favorability | |
| Most Liberal | 0.18 | −0.06 | 0.22 | −0.22 | 0.05 |
| (0.16) | (0.15) | (0.16) | (0.18) | (0.14) | |
| 2 | 0.5 *** | 0.26 * | 0.38 ** | 0.39 ** | 0.23 * |
| (0.15) | (0.14) | (0.16) | (0.16) | (0.13) | |
| 3 | 0.47 *** | 0.28 ** | 0.39 *** | 0.21 * | 0.06 |
| (0.12) | (0.12) | (0.13) | (0.12) | (0.11) | |
| 4 | 0.32 *** | 0.18 | 0.29 ** | 0.11 | 0.08 |
| (0.12) | (0.11) | (0.13) | (0.13) | (0.1) | |
| 5 (reference category) | |||||
| 6 | 0.01 | −0.15 | 0.09 | −0.15 | −0.08 |
| (0.1) | (0.1) | (0.11) | (0.11) | (0.09) | |
| 7 | 0.1 | 0.19 | 0.17 | 0.09 | 0.09 |
| (0.13) | (0.12) | (0.13) | (0.12) | (0.11) | |
| 8 | 0.25 ** | 0.22 * | 0.27 ** | 0.17 | 0.23 ** |
| (0.12) | (0.11) | (0.12) | (0.12) | (0.11) | |
| 9 | 0.47 *** | 0.24 * | 0.32 ** | 0.11 | 0.44 *** |
| (0.13) | (0.13) | (0.15) | (0.14) | (0.12) | |
| Most Conservative | 0.25 * | 0.02 | 0.34 ** | 0.03 | 0.41*** |
| (0.15) | (0.13) | (0.16) | (0.16) | (0.14) | |
| Constant | 3.7 *** | 4.16 *** | 3.68 *** | 3.96 *** | 3.57 *** |
| (0.09) | (0.08) | (0.09) | (0.09) | (0.08) | |
| Observations | 1456 | 1455 | 1456 | 1453 | 1458 |
| R-squared | 0.03 | 0.03 | 0.01 | 0.02 | 0.03 |
Standard errors are in parentheses. *** p < 0.01, ** p < 0.05, * p < 0.1. Regression using ideology expressed as factor variables, with “Middle category, 5” serving as the reference category.
| 1 | https://en.wikipedia.org/wiki/From_the_river_to_the_sea (accessed on 11 November 2023). |
| 2 | The terms antisemitism and anti-Jewish opinion (sentiment) are used interchangeably in this paper. |
| 3 | For example, it is important to distinguish right-wing authoritarianism (RWA) from right-wing ideology. RWA is a personality attribute, defined as individuals who are submissive to specific authority figures, act aggressively for those authorities, and are conformist toward traditional societal norms (Adorno et al. 1950; Altemeyer 1983; Raden 1999; Zakrisson 2005; Duckitt et al. 2010) Not all right-wingers or conservatives will have these traits, and it is possible for some on the left to also display aspects of authoritarianism (Van Hiel et al. 2006). |
| 4 | A large body of research has found anti-immigrant sentiment is associated with being on the political right (Chandler and Tsai 2001; Lahav and Courtemanche 2012; Pellegrini 2023). |
| 5 | A description of the questions used by the ADL can be found at ADL Global 100. 2015. http://global100.adl.org/#country/usa/2015 (accessed on 11 November 2023). |
| 6 | Staetsky defines the benchmark average individual as “a man or a woman aged 35–54 years, a Christian, with education below degree level, born in the UK and residing outside London; this average person is a centrist in political terms, does not display violent extremist tendencies and does not hold anti- Israel views; equally, he/she does not hold anti-capitalist, anti-immigration or antipolitical-correctness positions.” (p. 281). Such a person has only a 9% probability of holding antisemitic attitudes. |
| 7 | Respondents were asked whether they agree/disagree with these statements: (1) Jews are more loyal to Israel than to America, (2) It is appropriate for opponents of Israel’s policies and actions to boycott Jewish American owned businesses in their communities, and (3) Jews in the United States have too much power. |
| 8 | American Jews may be critical of Israel’s policies but overwhelming support its existence. |
| 9 | https://www.timesofisrael.com/meet-the-leading-jewish-political-donors-in-this-us-election-cycle/ (accessed on 11 November 2023). |
| 10 | These are the selections in weighted percentages of the “Not Sure” respondents on the seven-category ideology question, where Very Liberal equals “1” and Very Conservative equals “7”: (1) 7.7, (2) 5.6, (3) 8.1, (4) 63.6, (5) 6.1, (7) 4.4, (7) 4.5. |
| 11 | The F tests for Very Liberal and Very Conservatives versus Moderates are as follows: Very Liberal F = 227.85 (p = 0.000) and Very Conservative F = 306.62 (p = 0.000). The F test result for Moderates versus Not Sure is 643.65 (p = 0.000). The F test result for Very Liberal versus Very Conservative is not significant at 0.07 (p = 0.78). |
| 12 | The n is reduced because of missing data across the questions. |
| 13 | The distribution of responses for these two questions is similar on the full n of cases used as well as the small n using in the factor analysis. The Kaiser-Meyer-Olkin measure of sampling adequacy is 0.967 across all variables, with ranges from 0.95 to 0.98. These results strongly suggest sampling adequacy to compute a factor analysis on these data. |
References
- Adorno, Theodor W., Else Frenkel-Brunswik, Daniel J. Levinson, and Nevitt R. Stanford. 1950. The Authoritarian Personality. New York: Harper & Brothers. [Google Scholar]
- Allington, Daniel, and David Hirsh. 2019. The AzAs (antizionist antisemitism) scale: Measuring antisemitism as expressed in relation to Israel and its supporters. Journal of Contemporary Antisemitism 2: 43–52. [Google Scholar] [CrossRef]
- Altemeyer, Bob. 1983. Right-Wing Authoritarianism. Winnipeg: University of Manitoba Press. [Google Scholar]
- Alterman, Eric. 2016. The BDS movement and anti-Semitism on campus. New York Times, vol. 29. Available online: https://www.nytimes.com/2016/03/29/opinion/the-bds-movement-and-anti-semitism-on-campus.html (accessed on 11 November 2022).
- Antoniou, Giorgos, Elias Dinas, and Spyros Kosmidis. 2015. Collective Victimhood and Social Prejudice: A Post-Holocaust Theory of anti-Semitism. Political Psychology 41: 861–86. [Google Scholar] [CrossRef]
- Arendt, Hannah. 2012. Antisemitism: Part One of the Origins of Totalitarianism. New York: Houghton Mifflin Harcourt. First published 1958. [Google Scholar]
- Baum, Steven K., and Masato Nakazawa. 2007. Anti-Semitism versus Anti-Israeli Sentiment. Journal of Religion & Society 9: 1–8. [Google Scholar]
- Baum, Steven K., Neil J. Kressel, Florette Cohen, and Steven Leonard Jacobs, eds. 2016. Antisemitism in North America: New World, Old Hate. Leiden: Brill. [Google Scholar]
- Beattie, Peter. 2017. Anti-Semitism and opposition to Israeli government policies: The roles of prejudice and information. Ethnic and Racial Studies 40: 2749–67. [Google Scholar] [CrossRef]
- Ben-Moshe, Danny. 2015. The New Anti-Semitism in Europe: The Islamic Dimension of, and Jewish Belonging in, the EU. Islam and Christian–Muslim Relations 26: 219–36. [Google Scholar] [CrossRef]
- Bergmann, Werner. 2008. Anti-Semitic Attitudes in Europe: A Comparative Perspective. Journal of Social Issues 64: 343–62. [Google Scholar] [CrossRef]
- Bergmann, Werner, and Rainer Erb. 2003. Anti-Semitism in the late 1990s. In Germans or Foreigners? Attitudes toward Ethnic Minorities in Post-Reunification Germany. New York: Palgrave MacMillian, pp. 163–86. [Google Scholar]
- Blanchard, William H. 1984. Karl Marx and the Jewish question. Political Psychology 5: 365–74. [Google Scholar] [CrossRef]
- Blout, Emily, and Patrick Burkart. 2023. White supremacist terrorism in charlottesville: Reconstructing ‘unite the right’. Studies in Conflict & Terrorism 46: 1624–52. [Google Scholar]
- Bobako, Monika. 2017. The Palestinian Knot: The ‘New Anti-Semitism’, Islamophobia and the Question of Postcolonial Europe. Theory, Culture & Society 35: 99–120. [Google Scholar]
- Brodkin, Karen. 1998. How Jews Became White Folks and What That Says about Race in America. New Brunswick: Rutgers University Press. [Google Scholar]
- Brym, Robert, and Rhonda Lenton. 2022. Antisemitism, Anti-Israelism, and Canada in Context. In Israel and the Diaspora: Jewish Connectivity in a Changing World. New York: Springer, pp. 171–82. [Google Scholar]
- CBS News/New York Times. 1987. National Survey, April 1987, Question 28 [USCBSNYT.87APR.R22]. Ithaca: Cornell University, Roper Center for Public Opinion Research. [Google Scholar]
- Chandler, Charles R., and Yung-mei Tsai. 2001. Social factors influencing immigration attitudes: An analysis of data from the General Social Survey. The Social Science Journal 38: 177–88. [Google Scholar] [CrossRef]
- Chong, Dennis, Jack Citrin, and Morris Levy. 2022. The realignment of political tolerance in the United States. Perspectives on Politics, 1–22. [Google Scholar]
- Cohen, Florette, Lee Jussim, Gautam Bhasin, and Elizabeth Salib. 2011. The modern antisemitism israel model an empirical relationship between modern antisemitism and opposition to israel. Conflict Communication 10: 1–16. [Google Scholar]
- Cohen, Florette, Lee Jussim, Kent D. Harber, and Gautam Bhasin. 2009. Modern anti-Semitism and anti-Israeli attitudes. Journal of Personality and Social Psychology 97: 290–306. [Google Scholar] [CrossRef] [PubMed]
- Cohen, Jeffrey E. 2018a. Left, Right, and Antisemitism in European Public Opinion. Politics and Religion Journal 12: 341–71. [Google Scholar] [CrossRef]
- Cohen, Jeffrey E. 2018b. From Antisemitism to Philosemitism? Trends in American Attitudes toward Jews from 1964 to 2016. Religions 9: 107–28. [Google Scholar] [CrossRef]
- Crandall, Christian S., and Colby Cohen. 1994. The personality of the stigmatizer: Cultural world view, conventionalism, and self-esteem. Journal of Research in Personality 28: 461–80. [Google Scholar] [CrossRef]
- Dennen, Jacob, and Paul A. Djupe. 2023. Are Christian nationalists antisemitic and why? Social Science Quarterly 104: 299–314. [Google Scholar] [CrossRef]
- Dinnerstein, Leonard. 1995. Antisemitism in America. New York: Oxford University Press. [Google Scholar]
- Dinnerstein, Leonard. 2016. My Assessment of American Antisemitism Today. In Antisemitism in North America. Edited by Steven K. Baum, Neil J. Kressel, Florette Cohen and Steven Leonard Jacobs. Leiden: Brill, pp. 53–59. [Google Scholar]
- Duckitt, John. 2009. Authoritarianism and dogmatism. In Handbook of Individual Differences in Social Behavior. Edited by Mark R. Leary and Rick H. Hoyle. New York: Guilford Press, pp. 298–317. [Google Scholar]
- Duckitt, John, Boris Bizumic, Stephen W. Krauss, and Edna Heled. 2010. A tripartite approach to right-wing authoritarianism: The authoritarianism-conservatism-traditionalism model. Political Psychology 31: 685–715. [Google Scholar] [CrossRef]
- Dunbar, Edward. 1995. The prejudiced personality, racism, and anti-Semitism: The PR scale forty years later. Journal of Personality Assessment 65: 270–77. [Google Scholar] [CrossRef]
- Dunbar, Edward, and Lucie Simonova. 2003. Individual difference and social status predictors of anti-Semitism and racism US and Czech findings with the prejudice/tolerance and right wing authoritarianism scales. International Journal of Intercultural Relations 27: 507–23. [Google Scholar] [CrossRef]
- Fraser, Ronnie, and Lola Fraser. 2023. Challenging the Boycott, Divestment and Sanctions (BDS) Movement: 20 Years of Responding to Anti-Israel Campaigns. Abingdon: Taylor & Francis. [Google Scholar]
- Frindte, Wolfgang, Susan Wettig, and Dorit Wammetsberger. 2005. Old and New Anti-Semitic Attitudes in the Context of Authoritarianism and Social Dominance Orientation--Two Studies in Germany. Peace and Conflict: Journal of Peace Psychology 11: 239. [Google Scholar] [CrossRef]
- Gerstenfeld, Manfred. 2007. Anti-Israelism and Anti-Semitism: Common Characteristics and Motifs. Jewish Political Studies Review 19: 83–108. [Google Scholar]
- Givens, Terri E. 2022. The Roots of Racism: The Politics of White Supremacy in the US and Europe. Bristol: Policy Press. [Google Scholar]
- Greene, Jay P., and Ian Kingsbury. 2017. The relationship between public and private schooling and antisemitism. Journal of School Choice 11: 111–30. [Google Scholar] [CrossRef]
- Hersh, Eitan, and Laura Royden. 2023. Antisemitic attitudes across the ideological spectrum. Political Research Quarterly 76: 697–711. [Google Scholar] [CrossRef]
- Hirsh, David. 2007. Anti-zionism and antisemitism: Cosmopolitan reflections. In The Yale Initiative for the Interdisciplinary Study of Antisemitism. Working Paper Series; Edited by Charles Small. New Haven: Yale University, p. 164. [Google Scholar]
- Jaspal, Rusi. 2016. Anti-Semitism and Anti-Zionism: Representation, Cognition and Everyday Talk. New York: Routledge. [Google Scholar]
- Judaken, Jonathan. 2008. So what’s new? Rethinking the ‘new antisemitism’in a global age. Patterns of Prejudice 42: 531–60. [Google Scholar] [CrossRef]
- Kaplan, Edward H., and Charles A. Small. 2006. Anti-Israel Sentiment Predicts Anti-Semitism in Europe. Journal of Conflict Resolution 50: 548–61. [Google Scholar] [CrossRef]
- Kempf, Wilhelm. 2012. Anti-Semitism and criticism of Israel: A methodological challenge for peace research. Journal for the Study of Antisemitism 4: 515–32. [Google Scholar]
- Kempf, Wilhelm. 2015. Anti-Semitism and criticism of Israel: Methodology and results of the ASCI survey. Conflict & Communication 14: 1–20. [Google Scholar]
- Klug, Brian. 2003. The collective Jew: Israel and the new antisemitism. Patterns of Prejudice 37: 117–38. [Google Scholar] [CrossRef]
- Klug, Brian. 2013. Interrogating ‘new anti-Semitism’. Ethnic & Racial Studies 36: 468–82. [Google Scholar]
- Korey, William. 1972. The origins and development of Soviet anti-Semitism: An analysis. Slavic Review 31: 111–35. [Google Scholar] [CrossRef]
- Krekó, Péter. 2012. Back to the Roots: Are Antisemites Still Authoritarians? Journal for the Study of Antisemitism 4: 495–514. [Google Scholar]
- Kressel, Neil J. 2016. How to Interpret American Poll Data on Jews, Israel, and Antisemitism. Leiden: Brill. [Google Scholar]
- Kuhl, Stefan. 2002. The Nazi Connection: Eugenics, American Racism, and German National Socialism. Oxford: Oxford University Press. [Google Scholar]
- Lahav, Gallya, and Marie Courtemanche. 2012. The ideological effects of framing threat on immigration and civil liberties. Political Behavior 34: 477–505. [Google Scholar] [CrossRef]
- Laqueur, Walter. 2006. The Changing Face of Anti-Semitism: From Ancient Times to the Present Day. Oxford: Oxford University Press. [Google Scholar]
- Levin, Ines, Alexandra Filindra, and Jeffrey Kopstein. 2022. Validating a Measure of Antisemitism and Testing it Against Support for QAnon and Voting for Trump in 2020. Available online: https://papers.ssrn.com/sol3/papers.cfm?abstract_id=4104143 (accessed on 12 March 2023).
- Lipstadt, Deborah E. 2019. Antisemitism: Here and Now. New York: Schocken. [Google Scholar]
- Morris, Jessica. 2017. Identifying Correlates in Anti-Semitic Incidents on College Campuses in the US. Master’s thesis, Bridgewater State University, Bridgewater, MA, USA. [Google Scholar]
- Musiedlak, Didier. 2021. Wilhelm Marr (1819–1904) and the Left in Germany: The Birth of Modern Antisemitism. In The European Left and the Jewish Question, 1848–1992. Cham: Springer, pp. 81–94. [Google Scholar]
- Nicholls, William. 1995. Christian Antisemitism: A History of Hate. Lanham: Rowman & Littlefield. [Google Scholar]
- Pargament, Kenneth I., Kelly Trevino, Annette Mahoney, and Israela Silberman. 2007. They Killed Our Lord: The Perception of Jews as Desecrators of Christianity as a Predictor of Anti-Semitism. Journal for the Scientific Study of Religion 46: 143–58. [Google Scholar] [CrossRef]
- Pellegrini, Valerio. 2023. Populist ideology, ideological attitudes, and anti-immigration attitudes as an integrated system of beliefs. PLoS ONE 18: e0280285. [Google Scholar] [CrossRef] [PubMed]
- Pinkus, Benjamin. 1988. The Jews of the Soviet Union: The History of a National Minority. Cambridge: Cambridge University Press, vol. 62. [Google Scholar]
- Raden, David. 1999. Is Anti-Semitism Currently Part of an Authoritarian Attitude Syndrome? Political Psychology 20: 323–43. [Google Scholar] [CrossRef]
- Rosenfeld, Alvin H., ed. 2015. Deciphering the New Antisemitism. Bloomington: Indiana University Press. [Google Scholar]
- Roth, Steffen. 2016. Fashionable functions: A Google ngram view of trends in functional differentiation (1800–2000). In Politics and Social Activism: Concepts, Methodologies, Tools, and Applications. Hershey: IGI Global, pp. 177–203. [Google Scholar]
- Roth, Steffen, Carlton Clark, Nikolay Trofimov, Artur Mkrtichyan, Markus Heidingsfelder, Laura Appignanesi, Miguel Pérez-Valls, Jan Berkel, and Jari Kaivo-Oja. 2017. Futures of a distributed memory. A global brain wave measurement (1800–2000). Technological Forecasting and Social Change 118: 307–23. [Google Scholar] [CrossRef]
- Royden, Laura, and Eitan Hersh. 2022. The Young American Left and Attitudes About Israel. Contemporary Jewry 42: 1–20. [Google Scholar] [CrossRef]
- Rubinstein, William D. 2015. The Left, the Right and the Jews. New York: Routledge. [Google Scholar]
- Saxe, Leonard, Graham Wright, Shahar Hecht, Michelle Shain, Theodore Sasson, and Fern Chertok. 2016. Hotspots of Antisemitism and Anti-Israel Sentiment on US Campuses. Waltham: Brandeis University. [Google Scholar]
- Silva, Mario. 2017. Antisemitism and the Global Jihad. In Terrorism Revisited: Islamism, Political Violence and State-Sponsorship. Edited by Paulo Casaca and Siegfried O. Wolf. Switzerland: Springer, pp. 157–79. [Google Scholar]
- Smith, M. Brewster. 1997. The Authoritarian Personality: A Re-Review 46 Years Later. Political Psychology 18: 159–63. [Google Scholar] [CrossRef]
- Smith, Tom W. 1993. A review: Actual trends or measurement artifacts? A review of three studies of anti-Semitism. Public Opinion Quarterly 57: 380–93. [Google Scholar] [CrossRef]
- Staetsky, L Daniel. 2019. Is Criticism of Israel Antisemitic? What do British and French Jews Think about the Link between Antisemitic and Anti-Israel Attitudes among Non-Jews? In Unity and Diversity in Contemporary Antisemitism. Boston: Academic Studies Press, pp. 40–64. [Google Scholar]
- Staetsky, L Daniel. 2021. Quantifying Antisemitic Attitudes in Britain: The “Elastic” View of Antisemitism. In Confronting Antisemitism from Perspectives of Philosophy and Social Sciences. Berlin: Walter de Gruyter, pp. 67–74. [Google Scholar]
- Staetsky, L. Daniel. 2020. The Left, the Right, Christians, Muslims and Detractors of Israel: Who is Antisemitic in Great Britain in the Early 21st Century? Contemporary Jewry 40: 259–92. [Google Scholar] [CrossRef]
- Tausch, Arno. 2014. The New Global Antisemitism: Implications from the 100 Data. Middle East Review of International Affairs 18: 46–72. [Google Scholar]
- Tausch, Arno. 2018. The Effects of ‘Nostra Aetate’: Comparative Analyses of Catholic Antisemitism More Than Five Decades after the Second Vatican Council. Available online: https://ssrn.com/abstract=3098079 (accessed on 11 November 2023).
- Van Hiel, Alain, Bart Duriez, and Malgorzata Kossowska. 2006. The presence of left-wing authoritarianism in Western Europe and its relationship with conservative ideology. Political Psychology 27: 769–93. [Google Scholar] [CrossRef]
- Weil, Frederick D. 1985. The variable effects of education on liberal attitudes: A comparative-historical analysis of anti-semitism using public opinion survey data. American Sociological Review 50: 458–74. [Google Scholar] [CrossRef]
- Weisberg, Herbert Frank. 2019. The Politics of American Jews. Ann Arbor: University of Michigan Press. [Google Scholar]
- Weitzman, Mark. 2017. Every Sane Thinker Must Be an Anti-Semite: Antisemitism and Holocaust Denial in the Theology of Radical Catholic Traditionalists. In Antisemitism before and since the Holocaust. Edited by Anthony McElligott and Jeffrey Herf. London: Palgrave Macmillan, pp. 83–113. [Google Scholar]
- Welch, Susan. 2014. American opinion toward jews during the nazi era: Results from quota sample polling during the 1930s and 1940s. Social Science Quarterly 95: 615–35. [Google Scholar] [CrossRef]
- Wistrich, Robert S. 1994. Antisemitism: The Longest Hatred. Waltham: Cohen Center for Modern Jewish Studies, Brandeis University. [Google Scholar]
- Wistrich, Robert S. 2004. Anti-zionism and anti-semitism. Jewish Political Studies Review 16: 27–31. [Google Scholar]
- Wistrich, Robert S. 2012. From Ambivalence to Betrayal: The Left, the Jews, and Israel. Lincoln: University of Nebraska Press. [Google Scholar]
- Wistrich, Robert S. 2015. The Anti-Zionist Mythology of the Left. Israel Journal of Foreign Affairs 9: 189–99. [Google Scholar] [CrossRef]
- Wodak, Ruth, and Michał Krzyżanowski. 2017. Right-wing populism in Europe & USA: Contesting politics & discourse beyond ‘Orbanism’ and ‘Trumpism’. Journal of Language and Politics 16: 471–84. [Google Scholar]
- Wodak, Ruth. 2018. The Radical Right and Antisemitism. In The Oxford Handbook of the Radical Right. Edited by Jens Rydgren. New York: Oxford University Press, pp. 61–85. [Google Scholar]
- Wright, Graham, Michelle Shain, Shahar Hecht, and Leonard Saxe. 2017. The Limits of Hostility: Students Report on Antisemitism and anti-Israel sentiment at Four US Universities. Available online: https://scholarworks.brandeis.edu/esploro/outputs/report/The-Limits-of-Hostility/9924088139001921 (accessed on 20 August 2023).
- Wright, Graham, Sasha Volodarsky, Shahar Hecht, and Leonard Saxe. 2021. Trends in Jewish young adult experiences and perceptions of antisemitism in America from 2017 to 2019. Contemporary Jewry 41: 461–81. [Google Scholar] [CrossRef]
- Wright, Graham, Sasha Volodarsky, Shahar Hecht, and Leonard Saxe. 2022. Antisemitism and polarization: The political dynamics of American Jewish concerns about traditional and Israel-related antisemitism. Politics, Groups, and Identities, 1–19. [Google Scholar] [CrossRef]
- Zakrisson, Ingrid. 2005. Construction of a short version of the Right-Wing Authoritarianism (RWA) scale. Personality and Individual Differences 39: 863–72. [Google Scholar] [CrossRef]
- Zaller, John R. 1992. The Nature and Origins of Mass Opinion. New York: Cambridge University Press. [Google Scholar]
- Zimmermann, Mosche. 1986. Wilhelm Marr, the Patriarch of Antisemitism. Oxford: Oxford University Press on Demand. [Google Scholar]
Figure 1.
Ideology and Feeling Thermometer Rating toward Jews, ANES, 1972–2020. Note: Results based on Appendix A Table A1.
Figure 1.
Ideology and Feeling Thermometer Rating toward Jews, ANES, 1972–2020. Note: Results based on Appendix A Table A1.

Figure 2.
Favorability Toward Jews by Ideology Using Nationscape Data. Source: Nationscape.

Figure 3.
Feeling Thermometer Toward Jews by Ideology, VSG. Note: VL = Very Liberal, L = Liberal, M = Moderate, C = Conservative, VC = Very Conservative, NS = Not Sure. Source: Voter Study Group.
Figure 3.
Feeling Thermometer Toward Jews by Ideology, VSG. Note: VL = Very Liberal, L = Liberal, M = Moderate, C = Conservative, VC = Very Conservative, NS = Not Sure. Source: Voter Study Group.

Figure 4.
Agreement with Statements About Jews Hersh-Royden Data. Note: Based on results from Appendix A Table A4.
Figure 4.
Agreement with Statements About Jews Hersh-Royden Data. Note: Based on results from Appendix A Table A4.

Figure 5.
Attitudes Toward Jews and Ideology. Note: ML = Most Liberal, MC = Most Conservative. Source: UAS 2015 Data.
Figure 5.
Attitudes Toward Jews and Ideology. Note: ML = Most Liberal, MC = Most Conservative. Source: UAS 2015 Data.

Figure 6.
Favorability Toward Jews and Ideology. Source: UAS 2015 Data. Note: ML = Most Liberal and MC = Most Conservative.
Figure 6.
Favorability Toward Jews and Ideology. Source: UAS 2015 Data. Note: ML = Most Liberal and MC = Most Conservative.

Table 1.
UAS 2015 Questions Asking About Jews.
| Short Variable Name | UAS Var. Name | Question Wording |
|---|---|---|
| jloyal | t005a | Jews in the United States are more loyal to Israel than to this country. |
| jbusipower | t005b | Jews have too much power in the business world. |
| jfinpower | t005c | Jews have too much power in international financial markets. |
| jholocaust | t005d | Jews still talk too much about what happened to them in the Holocaust. |
| jdontcare | t005e | Jews don’t care what happens to anyone but their own kind. |
| jcontrolglobal | t005f | Jews have too much control over global affairs. |
| jcontrolusgov | t005g | Jews have too much control over the United States government. |
| jthinkbetter | t005h | Jews think they are better than other people. |
| jglobalmedia | t005i | Jews have too much control over the global media. |
| jwars | t005j | Jews are responsible for most of the world’s wars. |
| jbehavior | t005k | People hate Jews because of the way Jews behave. |
| jsameasall | t005l | Jews are just like everyone else. |
| jfav | t003a | Now, we would like to ask you your impressions of the following groups of people. For each one, please indicate whether you have a favorable or unfavorable opinion of them. |
Source: Understanding America Survey, UAS 15, Tolerance and Background, fielded 8 June 2015–3 January 2016. Survey authors, Jay Greene, and Gema Zamarro, https://uas.usc.edu/panel/ (accessed on 7 September 2022).
Table 2.
F Tests for Statistically Significant Differences in Warmth Rating for Several Ideological Comparisons.
Table 2.
F Tests for Statistically Significant Differences in Warmth Rating for Several Ideological Comparisons.
| 2020 | 2019 | 2017 | 2016 | |||||
|---|---|---|---|---|---|---|---|---|
| Comparison | F | p | F | p | F | p | F | p |
| Very Liberal vs. Moderate | 28.78 | 0.0000 | 30.87 | 0.0000 | 5.77 | 0.0163 | 24.62 | 0.0000 |
| Very Conservative vs. Moderate | 17.32 | 0.0000 | 9.95 | 0.0016 | 14.32 | 0.0002 | 11.90 | 0.0006 |
| Moderate vs. Not Sure | 10.46 | 0.0012 | 30.95 | 0.0000 | 1.81 | 0.1785 | 4.20 | 0.0405 |
| Very Liberal vs. Very Conservative | 0.15 | 0.7028 | 2.82 | 0.0934 | 0.72 | 0.3968 | 1.08 | 0.2994 |
Note: Based on estimations from Appendix A Table A3, using VSG data.
Table 3.
F Tests for Statistically Significant Differences in Statements of Support Jews for Several Ideological Comparisons, using Hersh-Royden Data.
Table 3.
F Tests for Statistically Significant Differences in Statements of Support Jews for Several Ideological Comparisons, using Hersh-Royden Data.
| Loyal | Boycott | Power | ||||
|---|---|---|---|---|---|---|
| Comparison | F | p | F | p | F | p |
| Very Liberal v. Moderate | 47.84 | 0.0000 | 13.15 | 0.0003 | 54.17 | 0.0000 |
| Very Conservative v. Moderate | 0.07 | 0.7871 | 0.37 | 0.5413 | 0.60 | 0.4380 |
| Moderate v Not Sure | 0.58 | 0.4458 | 1.69 | 0.1932 | 0.90 | 0.3416 |
| Very Liberal v. Very Conservative | 43.59 | 0.0000 | 6.37 | 0.0117 | 29.52 | 0.0000 |
Note: Based on estimations from Appendix A Table A4.
Table 4.
F Tests for Statistically Significant Differences in Statements of Support Jews for Several Ideological Comparisons, using UAS Data.
Table 4.
F Tests for Statistically Significant Differences in Statements of Support Jews for Several Ideological Comparisons, using UAS Data.
| Liberal (9) vs. Moderate (6) | Conservative (2) vs. Moderate (5) | Liberal (9) vs. Conservative (2) | ||||
|---|---|---|---|---|---|---|
| Variable | F | p | F | p | F | p |
| Loyal | 0.84 | 0.36 | 3.15 | 0.08 | 0.48 | 0.49 |
| Business power | 4.86 | 0.03 | 6.87 | 0.01 | 0.33 | 0.57 |
| International Finance | 12.29 | 0.000 | 8.18 | 0.004 | 0.07 | 0.43 |
| Holocaust | 8.72 | 0.003 | 3.43 | 0.06 | 0.06 | 0.79 |
| Don’t care | 5.20 | 0.02 | 8.56 | 0.004 | 0.73 | 0.39 |
| Global control | 10.02 | 0.002 | 15.40 | 0.001 | 0.14 | 0.70 |
| US Govt. control | 11.49 | 0.001 | 12.17 | 0.001 | 0.00 | 0.99 |
| Think better | 10.49 | 0.001 | 4.26 | 0.04 | 0.02 | 0.88 |
| Global media | 14.81 | 0.001 | 10.80 | 0.001 | 0.05 | 0.82 |
| Wars | 11.38 | 0.001 | 3.30 | 0.07 | 0.02 | 0.89 |
| Behavior | 3.27 | 0.07 | 5.84 | 0.02 | 0.11 | 0.73 |
| Jews same | 5.01 | 0.03 | 6.33 | 0.01 | 3.02 | 0.08 |
| Favorability | 26.49 | 0.000 | 3.02 | 0.08 | 2.37 | 0.12 |
Source: Understanding America Survey, UAS 15, Tolerance and Background, fielded 8 June 2015–3 January 2016. Survey authors, Jay Greene and Gema Zamarro, https://uas.usc.edu/panel/ (accessed on 7 September 2022). The numbers in parentheses indicate the ideological categories being compared.
Table 5.
Eigenvalues Based on Factor Analysis of 13 Questions Regarding Jews, UAS 2015 Data.
| Factor | Eigenvalue | Difference | Proportion | Cumulative |
|---|---|---|---|---|
| Factor 1 | 7.449 | 7.075 | 0.998 | 0.998 |
| Factor 2 | 0.374 | 0.281 | 0.050 | 1.048 |
| Factor 3 | 0.093 | 0.064 | 0.013 | 1.061 |
| Factor 4 | 0.029 | 0.004 | 0.004 | 1.065 |
| Factor 5 | 0.025 | 0.040 | 0.003 | 1.068 |
| Factor 6 | −0.015 | 0.015 | −0.002 | 1.066 |
| Factor 7 | −0.030 | 0.011 | −0.004 | 1.062 |
| Factor 8 | −0.042 | 0.004 | −0.006 | 1.056 |
| Factor 9 | −0.046 | 0.027 | −0.006 | 1.050 |
| Factor 10 | −0.073 | 0.004 | −0.010 | 1.040 |
| Factor 11 | −0.077 | 0.014 | −0.010 | 1.030 |
| Factor 12 | −0.091 | 0.041 | −0.012 | 1.018 |
| Factor 13 | −0.132 | . | −0.018 | 1.000 |
n = 1443. The 13 questions are from Figure 5 and Figure 6. Source: Understanding America Survey, UAS 15, Tolerance and Background, fielded 8 June 2015–3 January 2016. Survey authors, Jay Greene and Gema Zamarro, https://uas.usc.edu/panel/ (accessed on 7 September 2022).
Table 6.
Factor Loadings of 13 Questions Regarding Attitudes Toward Jews, UAS 2015 Data.
| Variable | Factor1 | Factor2 | Factor3 | Factor4 | Factor5 | Uniqueness |
|---|---|---|---|---|---|---|
| Loyal | 0.705 | −0.009 | −0.105 | −0.016 | 0.035 | 0.491 |
| Business power | 0.859 | −0.202 | 0.077 | −0.060 | 0.018 | 0.211 |
| International Finance | 0.833 | −0.260 | 0.019 | −0.048 | 0.047 | 0.233 |
| Holocaust | 0.750 | 0.158 | −0.045 | −0.035 | −0.027 | 0.408 |
| Don’t care | 0.816 | 0.203 | −0.033 | −0.033 | 0.043 | 0.288 |
| Global control | 0.860 | −0.200 | 0.007 | 0.074 | −0.015 | 0.214 |
| US Govt. control | 0.857 | −0.078 | 0.062 | 0.062 | −0.025 | 0.251 |
| Think better | 0.789 | 0.112 | −0.051 | 0.033 | 0.079 | 0.355 |
| Global media | 0.840 | −0.136 | 0.013 | 0.000 | −0.063 | 0.271 |
| Wars | 0.768 | 0.134 | −0.066 | −0.060 | −0.084 | 0.378 |
| Behavior | 0.719 | 0.129 | −0.095 | 0.075 | −0.011 | 0.452 |
| Jews same | 0.400 | 0.218 | 0.161 | −0.011 | −0.003 | 0.766 |
| Favorability | 0.470 | 0.201 | 0.165 | 0.021 | 0.012 | 0.711 |
n = 1443. The 13 questions are from Figure 5 and Figure 6. Source: Understanding America Survey, UAS 15, Tolerance and Background, fielded 8 June 2015–3 January 2016. Survey authors, Jay Greene and Gema Zamarro, https://uas.usc.edu/panel/ (accessed on 7 September 2022).
Table 7.
F Tests for Statistically Significant Differences in Statements of Support Jews for Most Liberal vs. Liberal and Most Conservative v. Conservative.
Table 7.
F Tests for Statistically Significant Differences in Statements of Support Jews for Most Liberal vs. Liberal and Most Conservative v. Conservative.
| Liberal (10) vs. Liberal (9) | Conservative (1) vs. Conservative (2) | |||
|---|---|---|---|---|
| Variable | F | p | F | p |
| Loyal | 0.16 | 0.69 | 0.59 | 0.44 |
| Business power | 0.05 | 0.82 | 1.89 | 0.17 |
| International Finance | 3.41 | 0.06 | 0.54 | 0.46 |
| Holocaust | 1.15 | 0.28 | 0.04 | 0.83 |
| Don’t care | 0.09 | 0.77 | 0.92 | 0.34 |
| Global control | 0.81 | 0.37 | 0.82 | 0.36 |
| US Govt. control | 0.80 | 0.37 | 1.07 | 0.30 |
| Think better | 2.02 | 0.16 | 0.07 | 0.79 |
| Global media | 1.99 | 0.16 | 3.11 | 0.08 |
| Wars | 2.39 | 0.12 | 3.35 | 0.07 |
| Behavior | 0.01 | 0.93 | 0.73 | 0.39 |
| Jews same | 0.26 | 0.61 | 9.68 | 0.02 |
| Favorability | 0.04 | 0.83 | 1.26 | 0.26 |
Source: Understanding America Survey, UAS 15, Tolerance and Background, fielded 8 June 2015–3 January 2016. Survey authors, Jay Greene and Gema Zamarro, https://uas.usc.edu/panel/ (accessed on 7 September 2022).
Disclaimer/Publisher’s Note: The statements, opinions and data contained in all publications are solely those of the individual author(s) and contributor(s) and not of MDPI and/or the editor(s). MDPI and/or the editor(s) disclaim responsibility for any injury to people or property resulting from any ideas, methods, instructions or products referred to in the content. |
© 2024 by the author. Licensee MDPI, Basel, Switzerland. This article is an open access article distributed under the terms and conditions of the Creative Commons Attribution (CC BY) license (https://creativecommons.org/licenses/by/4.0/).
Share and Cite
MDPI and ACS Style
Cohen, J.E. Ideology and Attitudes toward Jews in U.S. Public Opinion: A Reconsideration. Religions 2024, 15, 59. https://doi.org/10.3390/rel15010059
AMA Style
Cohen JE. Ideology and Attitudes toward Jews in U.S. Public Opinion: A Reconsideration. Religions. 2024; 15(1):59. https://doi.org/10.3390/rel15010059
Chicago/Turabian StyleCohen, Jeffrey E. 2024. "Ideology and Attitudes toward Jews in U.S. Public Opinion: A Reconsideration" Religions 15, no. 1: 59. https://doi.org/10.3390/rel15010059
Note that from the first issue of 2016, this journal uses article numbers instead of page numbers. See further details here.